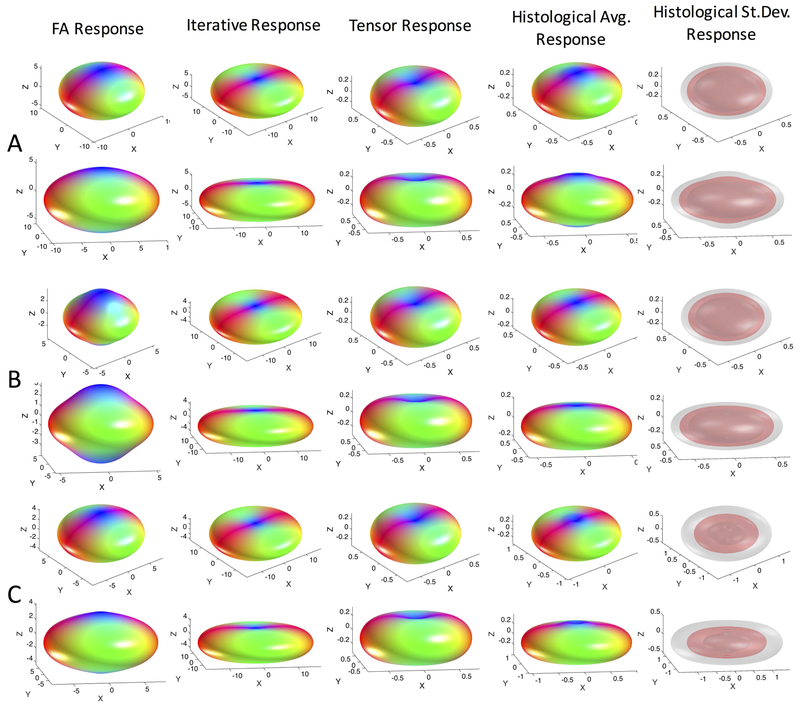
Figure 2.
Response functions estimated using conventional methods differ from the histologically-derived response functions. Kernels estimated using the highest FA voxels, the iterative calibration method, and modelled from the diffusion tensor are shown in two views. The average histologically-derived response function for each monkey (across 6 z-stacks) is shown (monkeys #1–3 correspond to A-C) along with the mean (red) and mean +/− one standard deviation (gray) surfaces to highlight variability. Note differences in magnitude are due to differing normalization in our work and in MRTrix3. Shape, and not magnitude, determines the final FOD shape.

