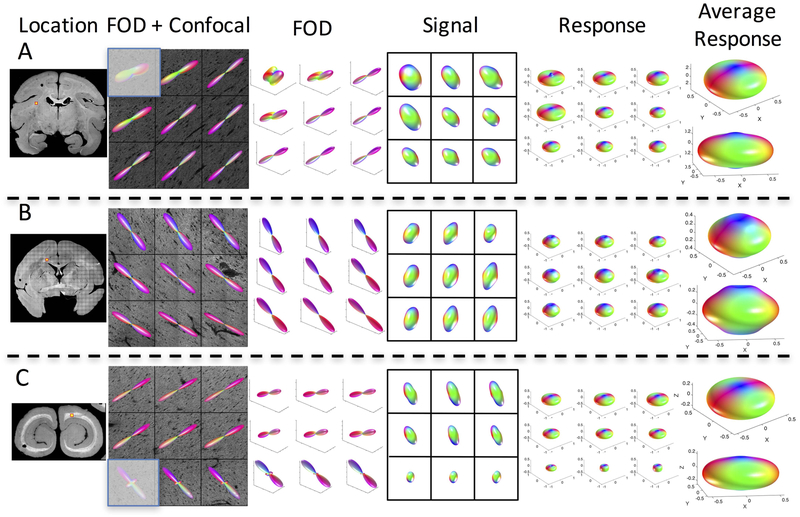
Figure 3.
The response function varies across brain regions. Three locations in the same monkey brain (monkey #1) are shown, along with the histological fiber orientation distribution, signal, and derived response function for all 9 voxels. In addition, the average response function for each z-stack is shown in two views. Grayed-out voxel contained some gray matter and hence was not included in the study (or in derivation of average response).

