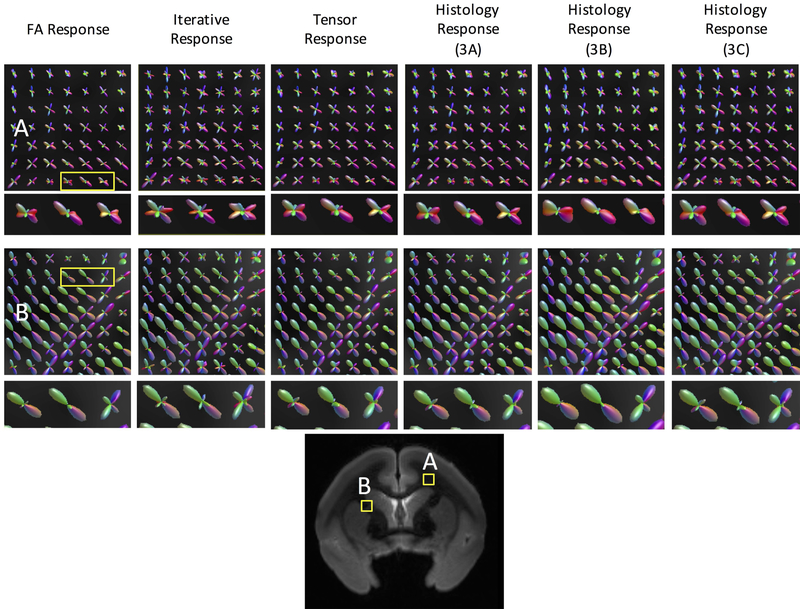
Figure 6.
Different response functions lead to different FOD reconstructions. Fiber reconstruction in two regions of interest (A and B) using three commonly implemented response functions (FA Response, Iterative Response, Tensor Response), and three histologically derived response functions (those from Figure 3A, 3B, and 3C) from the same monkey. Reconstructed fiber orientation distributions retain similar shape and orientations, but contain different volume fractions of fiber populations. A zoomed-in region of 3 voxels is shown for each reconstruction to highlight differences/similarities.

