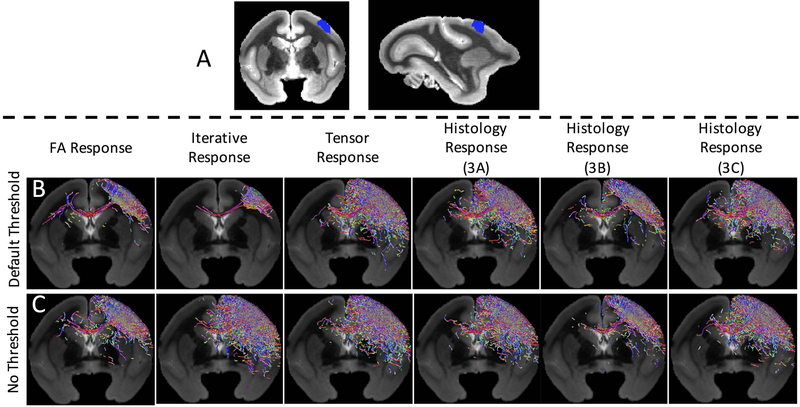
Figure 7.
Different response functions can lead to different tractography results. Whole-brain tractography is performed with an inclusion region in the primary motor cortex (A) using the FODs described in Figure 6, using standard tractography parameters and settings (i.e., the FOD amplitude threshold) (B). Tractography is repeated using no threshold on FOD amplitude, resulting in qualitatively similar streamlines (C). Note that only streamlines within a single coronal slice are visualized.

