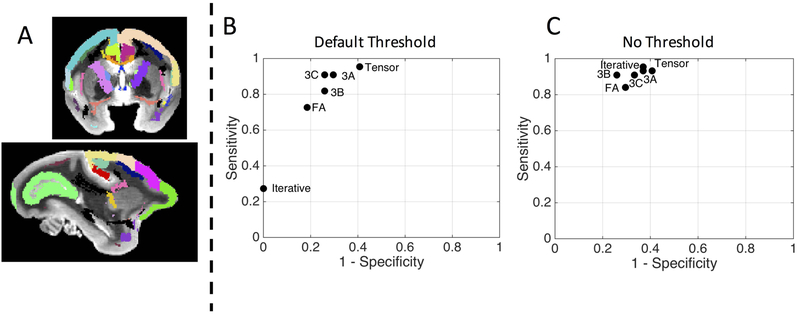
Figure 8.
Different response functions can lead to different tractography results. Tractography is compared to an atlas of known connections (atlas and histology described in46,63, see Figure 2 from53 and Figure 1B from49 for visualization of the ground truth pathways), by calculating the true positive and true negative rate of connections to various regions of interest (A). The sensitivity and specificity of the tractography results from Figure 7 are plotted in an ROC curve using the default FOD threshold (B) and no FOD threshold (C). Method abbreviations: FA: average FA response; ITER: iterative response; Tensor: tensor-derived response; 3A-C: histological-derived response from z-stacks A-C from Figure 3.

