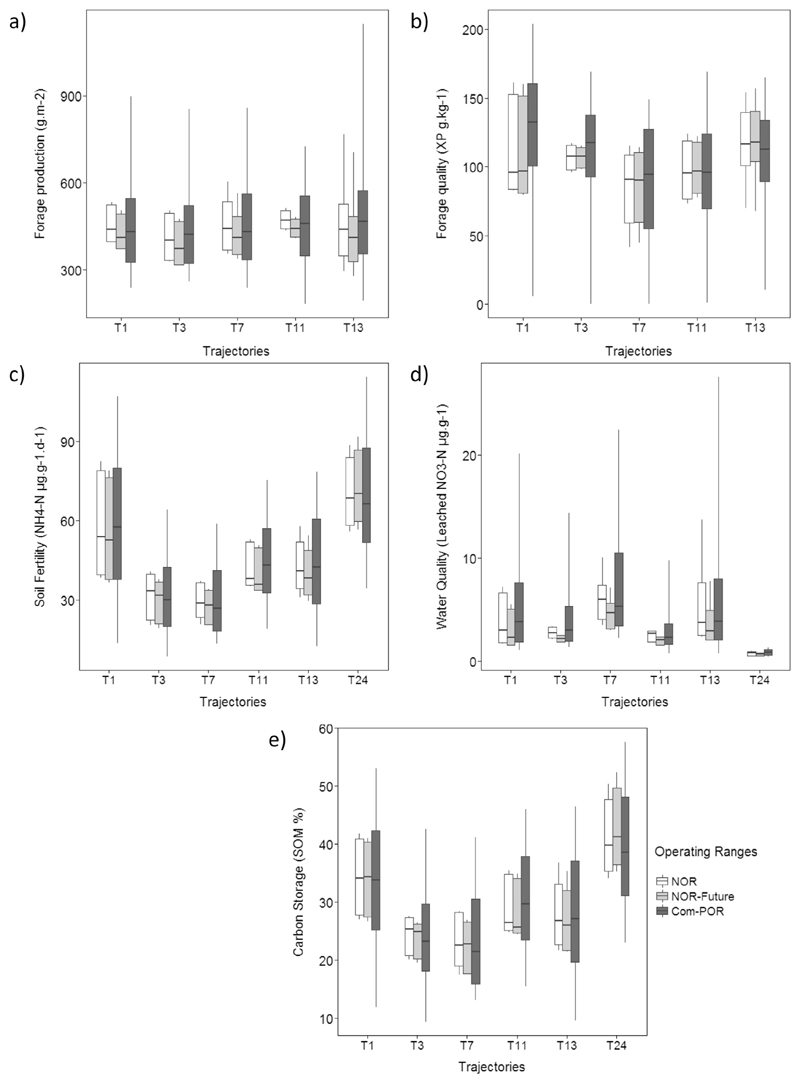
Fig. 6.
Current (NOR) and future resistance (NOR-Future) and resilience (Com-POR) of selected trajectories for a) forage production, b) forage quality, c) soil fertility, d) water quality, and e) carbon storage. Trajectories represent different grassland types: T1 - unfertilised grassland 1200–1500 m a.s.l., T3 - unfertilised grassland > 1500 m a.s.l., T7 - fertilised grassland < 1200 m a.s.l., T11 - fertilised grassland 1200–1500 m a.s.l., T13 - fertilised grassland > 1500 m a.s.l., T24 - abandoned grassland > 1500 m a.s.l. Boxes represent values within the 5th to 95th percentile; whiskers contain values outside of this range, i.e. minimum to maximum values. A small overlap between the NOR/NOR-Future and Com-POR indicates high resilience potential, whereas a great overlap indicates high transformation potential.

