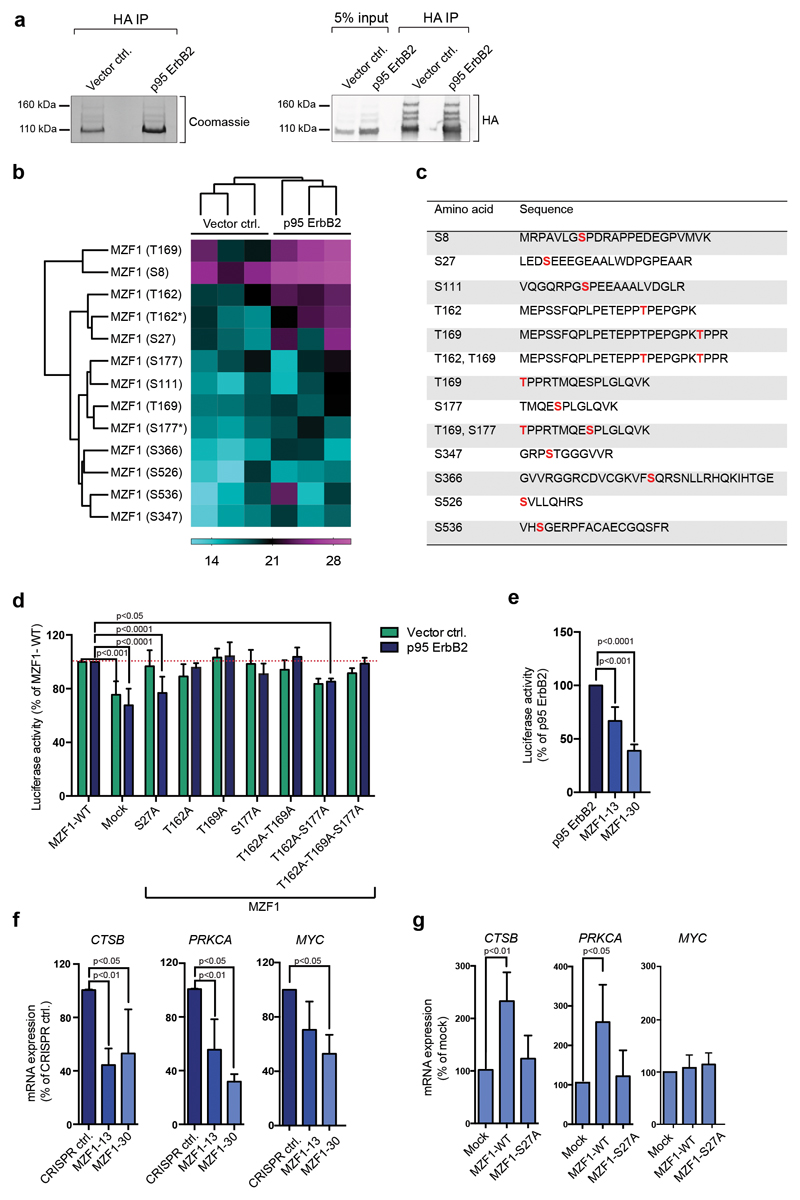
Figure 1. MZF1 is phosphorylated and activated in response to ErbB2 signaling.
(a) WT HA-MZF1 immunoprecipitates used for phosphopeptide analysis were immunoblotted for the detection of HA (right) and stained with Coomassie brilliant blue (left). The 100-kDa MZF1 form was used for the phosphor mass spectrometry analysis. The immunoblot is a representative of three independent experiments.
(b) Increased phosphorylation of several MZF1 peptides isolated from p95-ErbB2-MCF7 cells. Heatmap depicting the log2-transformed phosphopeptide LFQ intensities from three independent experiments. Label-free quantification was done using the MaxQuant software, followed by analysis with the Perseus software. MaxQuant was set to identify peptides with a phosphosite probability > 75%. * marks the di-phosphorylated sites.
(c) List of identified phosphopeptides. Identified phosphosites are highlighted in red.
(d) MZF1-S27A fails to activate CTSB reporter activity in response to ErbB2. Vector MCF7 and p95-ErbB2-MCF7 cells were transfected with the CTSB firefly luciferase and the Renilla luciferase construct and the empty (mock) or MZF1-WT or indicated MZF1 mutant pcDNA3.1 plasmids. Reporter activity was calculated as the firefly luciferase activity divided by the Renilla luciferase activity and presented as a percentage of the MZF1-WT control. Data shown are mean ± standard deviation of three independent experiments. Statistical significance was calculated with one-way ANOVA with Dunnett’s correction.
(e) CTSB reporter activity is decreased in p95-ErbB2-expressing CRISPR MZF1-13 and 30 cells. The cells were transfected with CTSB firefly luciferase and the Renilla control luciferase constructs, and their activities and statistical significances were calculated as in d. Results are presented as the percentages of the luciferase activity of the parental cells and the data is presented as a mean ± standard deviation of three independent experiments.
(f) MZF1 depletion in CRISPR MZF1-13 and -30 cells decreases the expression of the MZF1 target genes CTSB, PRKCA and MYC, as compared to the levels of the expression of the control cell line. Quantitative RT-PCR analysis of MZF1 target gene expression. The indicated target gene mRNA expression was normalized to the expression of PPIB and is presented as the percentage of its expression in CRISPR control cells. Values shown are mean ± standard deviation of three independent experiments. Statistical significance was calculated as in d.
(g) Ectopic expression ofMZF1-WT, but not of MZF1-S27A, rescues the expression of endogenous CTSB and PRKCA in CRISPR MZF1-30 cells; neither MZF1-WT nor MZF1-S27A rescues the expression of MYC. Quantitative RT-PCR analysis of MZF1 target gene expression in CRISPR MZF1-30 cells. Cells were transfected with empty (mock) or MZF1-WT or MZF-S27A Δt-3xHA plasmids. Indicated mRNA expression was normalized to the expression of PPIB and presented as % of its expression in mock-transfected samples. Values represent mean ± standard deviation of three independent experiments. Statistical significance was calculated with the Student’s t-test (unpaired with Welch’s correction).

