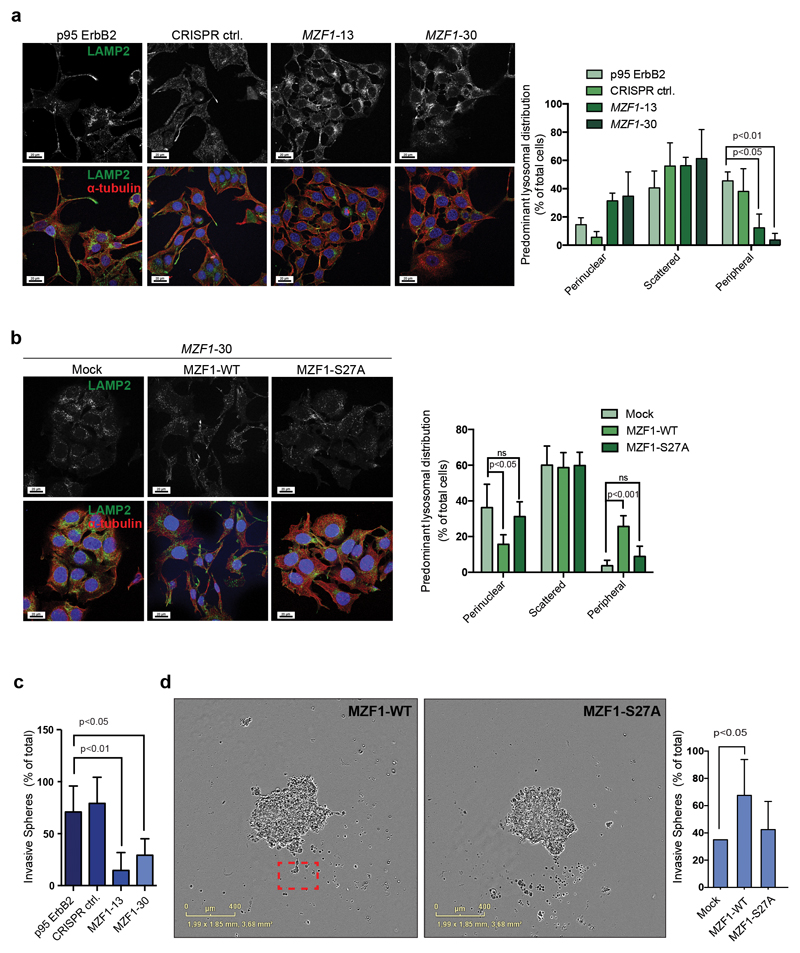
Figure 2. MZF1-WT, but not MZF1-S27A, can mediate invasive ErbB2 signaling in BC cells.
(a) MZF1 depletion in CRISPR MZF1-13 and-30 cells reverse the lysosome distribution pattern from peripheral to perinuclear. Representative images of lysosomal distributions detected by immunostaining of the endogenous LAMP2 (green). Staining for α-tubulin (red) is used to mark the cytoskeleton, and Hoechst staining (blue) is used to detect the nucleus. The right-side columns show the quantification of the immunofluorescence images. Data shown are mean ± standard deviation of three independent experiments in which minimum of 4 images with 8-25 cells was analyzed. Statistical significance was calculated using one-way ANOVA with Dunnett’s correction.
(b) Ectopic expression of MZF1-WT, but not of MZF1-S27A, alters the lysosome distribution of CRISPR MZF1-30 cells from perinuclear to peripheral. Cells were transfected with empty (mock) or MZF1-WT or MZF1-S27A Δt-3xHA plasmids. Representative images of lysosomal distribution detected by immunostaining of the endogenous LAMP2 (green). Staining with α-tubulin (red) is used to indicate the cytoskeleton, and Hoechst staining (blue) the nucleus. The images were quantified as in a (right-side columns). Values shown are mean ± standard deviation of three independent experiments in which a minimum of 4 images with 8-25 cells was analyzed. Statistical significance was calculated as in a.
(c) MZF1 depletion in CRISPR MZF1-13 and -30 cells renders the cells less invasive in 3D Matrigel invasion assays than the corresponding MZF1-expressing CRISPR control cells. Invasive spheroids were counted from three biological repeats of six spheroids each. Values shown are mean ± standard deviation of the three biological repeats. Representative images are presented in Figure S3B. Statistical significance was calculated as in a.
(d) Expression of MZF1-WT, but not that of MZF1-S27A, rescues the invasion deficiency of the CRISPR MZF1-30 cells. Cells were transfected with empty (mock) or MZF1-WT or MZF1-S27A plasmids and the corresponding spheroids were analyzed for their invasiveness in the 3D MBE Matrix by imaging every 4 h. The images shown are representative of invasive (MZF1-WT) and non-invasive (MZF1-S27A) spheroids selected from corresponding movies. Invasive cells are marked with a red square. Ten spheroids from four biological repeats were quantified per treatment. Results are presented as percentage of total number of spheroids. Values shown are mean ± standard deviation of four independent experiments. Statistical significance was calculated as in a.

