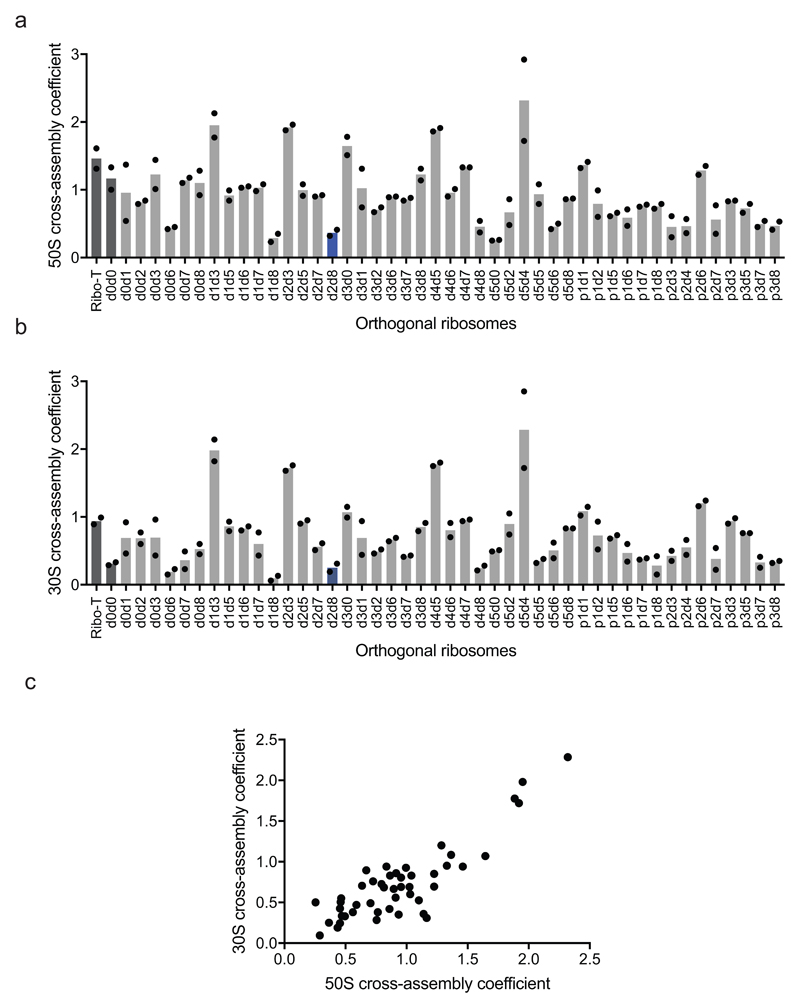
Extended Data Figure 3. Engineered O-stapled ribosome variants minimize cross assembly.
a Screen of 50S cross-assembly coefficients for different O-ribosomes with linked subunits. n = 2 biological replicates; each replicate is shown by a dot, and the bars represent the means (using the same dataset as in Fig. 2d). b, Screen of 30S cross-assembly coefficients. n = 2 biological replicates; each replicate is shown by a dot, and the bars represent the means (using the same dataset as in Fig. 2e). In a and b, more than 90% of ribosomes had cross-assembly coefficients between 0 and 1, as expected. Previously reported O-ribosomes with linked subunits are shown in dark grey, while O-d2d8 is highlighted in blue. c, Correlation between the means (from n = 2 biological replicates) of 50S and 30S cross-assembly coefficients for different O-stapled ribosome variants; the variation in these data is shown in a, b.

