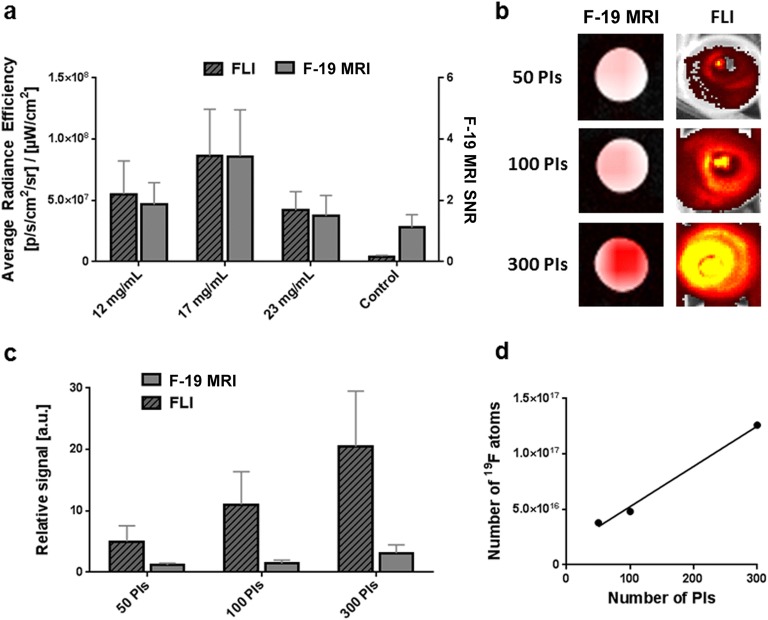
Fig. 2.
In vitro visualization of pancreatic islets labeled using endocytosis by F-19 MR and fluorescence imaging. a Comparison of signals originating from 300 islets labeled with different concentrations of nanoparticles. b Representative F-19 MR and FLI images of different numbers of islets labeled using 17 mg/ml of PLGA-NP. c Visualization sensitivity of various numbers of islets labeled at a 17 mg/ml concentration, where the relative signal is normalized to the signal from unlabeled islets. d Absolute quantification of the number of F-19 atoms incorporated in labeled islets.

