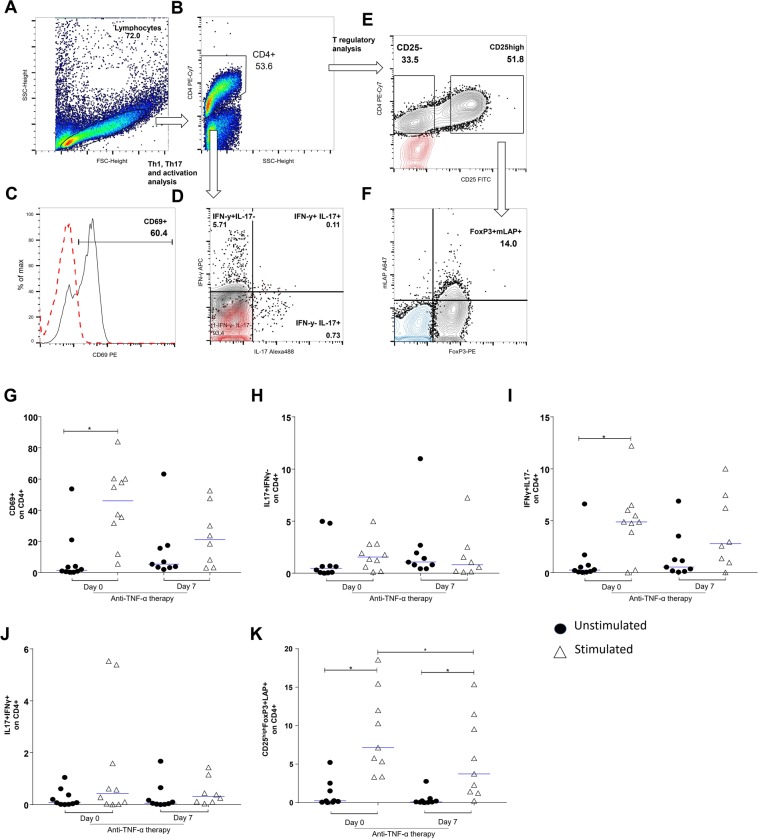
Figure 2.
Flow cytometric analysis of cell activation markers and intra-cellular cytokine expression on CD4+ T-lymphocytes (TL): PBMCs were obtained prior to pulse therapy (day 0) and during pulse therapy (day 7) of patients with severe plaque psoriasis treated with anti-TNF agents. PBMC, cultured for 48 h in the presence of medium (unstimulated) or with anti-CD3 and anti-CD28 mAbs (stimulated). After recovered, PBMC were incubate with appropriate mAbs and isotype controls. Panels A to F show gates strategies for analysis. In panels C–E the red dots indicate the labeling of the control isotypes. In panel F, the blue dots indicate the CD25− population. Panel G: CD69+ on CD4+ TL (Wilcoxon p < 0.05), panel H: IL-17+IFN-γ− on CD4+ LT (Wilcoxon p > 0.05), panel I: IL-17− IFN-γ+ on CD4+ LT (Wilcoxon p < 0.05), panel J: IL-17+IFN-γ+ on CD4+ LT (Wilcoxon p > 0.05) and panel K: CD25highFoxP3+LAP+ on CD4+ LT (Wilcoxon p < 0.05). The results are expressed in percentage on the CD4+ TL. *Indicate statistical significance.

