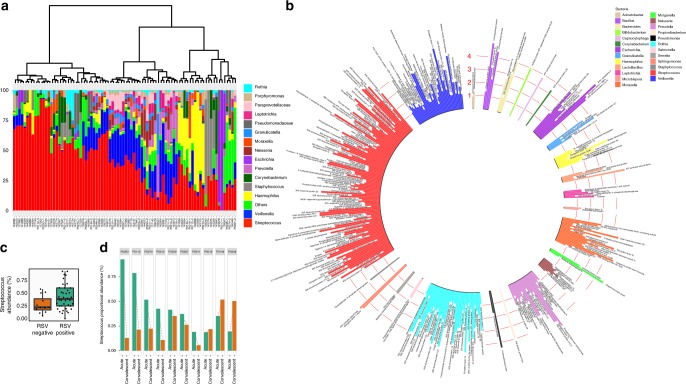
Fig. 1.
The composition of the airway microbiota. a Dendrogram visualising the hierarchical clustering of individual microbiomes of 84 individual children on the basis of the Bray–Curtis dissimilarity matrix. The relative abundance of the 15 highest-ranked operational taxonomic units are presented for each study participant as stacked bar charts. operational taxonomic units under the ‘others’ heading are an aggregate of bacteria that occurred at low abundances (<1%). The taxonomic identities of these low-abundance operational taxonomic units are presented in Supplementary Data 1. b The proteome of the upper airway microbiota (metaproteome) was characterised by mass spectrometric analysis using airway samples from 84 children and the results are presented in a circular bar chart. Each bar represents the mean expression level of one bacterial protein. Values on the y-axis correspond to MS protein expression levels (log10 reporter corrected intensity). Most of the bacterial operational taxonomic units that were identified in metagenomic analyses of the airway microbiota were also identified in the proteome. The highest number of protein identifications belonged to the genus Streptococcus and comprised mainly of ribosomal proteins and proteins involved in energy metabolism pathways. c The abundance of Streptococcus in the airway was compared between RSV-positive and RSV-negative children. RSV-infected children had a higher abundance of airway Streptococcus compared to RSV-negative children. d The effect of RSV infection on Streptococcal colonisation of the upper airway was characterised using a subset of 10 children from whom nasopharyngeal and oropharyngeal swabs were obtained during acute RSV infection and at convalescence, approximately one month later. Seven out of 10 children (70%) exhibited declines in the airway abundance of Streptococcus upon recovery from RSV, while for three children, convalescent-stage Streptococcus abundance was either unchanged from the acute time point or was higher. On the box and whisker plot, the bottom line on the box denotes the 25th data percentile (quartile 1), the middle line denotes the median and the upper line denotes the 75th data percentile (quartile 3). The bottom whisker represents data in the lower extremity of the distribution (quartile 1–1.5 × interquartile range) and upper whisker denotes the upper extremity of the distribution (quartile 3 + 1.5 × interquartile range). Source data are provided as a Source Data file

