Fig. 3.
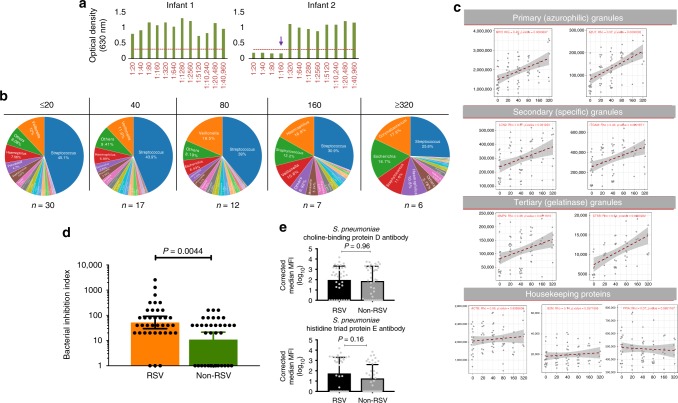
Analysis of bacterial inhibition activity in airway secretions. a Example plots of children with different bacterial inhibition activities. The y-axis represents the optical density which is directly related to the amount of bacterial (Streptococcus pneumoniae) growth: bacterial growth increases turbidity of the culture media resulting in a proportional increase in optical density. The x-axis represents a doubling dilution of nasal samples from 1:20 to 1:40,960. The dashed horizontal red line denotes an optical density cutoff above which substantial turbidity of the culture media was observed. Nasal secretions from infant 1 were unable to inhibit bacterial growth at any dilution (bacterial inhibition index [BII] = 0). Nasal secretions from infant 2 completely inhibited pneumococcal growth at dilutions ≤ 1:160 (BII = 160). b Children were categorised into five BII strata and differences in the proportional abundance of different bacterial taxa in each stratum presented in pie charts. The airway abundance of Streptococcus decreased with increasing bacterial inhibition activity. c Bacterial inhibition activity in nasal samples (N = 72) was correlated with the expression levels of neutrophil-granule proteins (stratified by functional subset). Representative proteins from all three subsets of neutrophil granules (azurophilic, specific and gelatinase) were positively correlated with bacterial inhibition activity (complete analysis of the correlation between bacterial inhibition activity and all the neutrophil granule proteins can be found in Supplementary Fig. 2). In contrast, there was no correlation between the expression levels of housekeeping proteins (ACTB, B2M and PPIA) and bacterial inhibition activity in nasal samples. Correlation analysis was done using Spearman’s rank order correlation. d Bacterial inhibition activity was compared between RSV-positive (N = 36) and RSV-negative children (N = 36). The mean BII level in RSV-infected children (geometric mean: 52) was significantly greater than the mean BII in RSV-negative children (geometric mean: 10.9). Error bars indicate 95% confidence intervals. e Mean airway IgG levels to two Streptococcus pneumoniae proteins (choline-binding protein D and Histidine Triad protein E) were compared between RSV-positive (N = 36) and RSV-negative children (N = 36). Error bars indicate 95% confidence intervals. P-values in d and e were based on Mann–Whitney U-test. Source data are provided as a Source Data file

