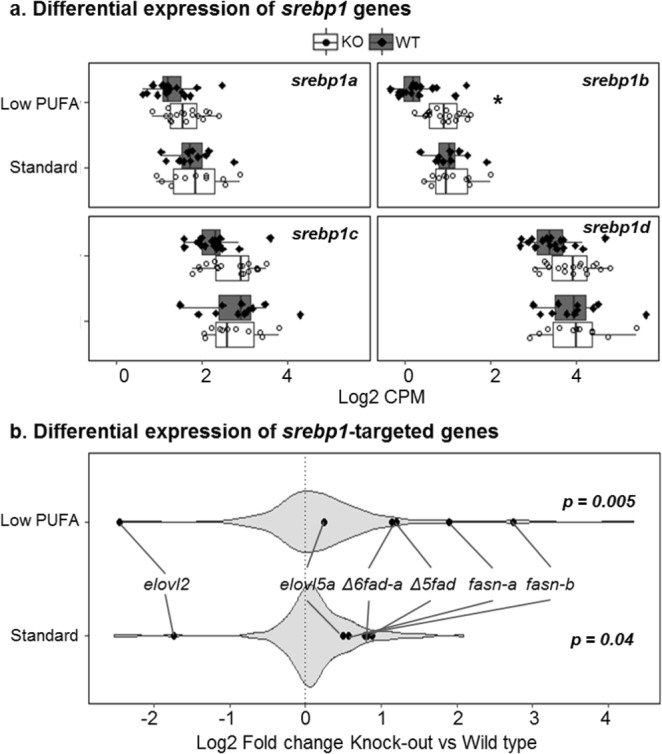
Figure 4.

Expressional change of hepatic srebp-1 genes (a) and their targeted-genes (b) between elovl2 knockout (KO) and wildtype (WT) salmon fed either low PUFA or standard commercial diet. (a) Boxplots displaying all four srebp-1 genes with their respective expression (log2 CPM) in KO and WT salmon fed either low PUFA or standard diet. Asterisks indicates differential expression (q < 0.05). (b) Violin plot showing 183 lipid genes with least 1 Srebp-1-targeted motif in the promoter region. The density of the plot is proportional to the number of genes in each log2 fold change unit. Both fish fed low PUFA or standard diet showed significant enrichment of the Srebp-1-targeted genes. Gene expression analysis was performed using n = 18 elovl2 KO + n = 18 WT fed low PUFA diet, and n = 11 each of elovl2 KO and WT fed standard diet.
