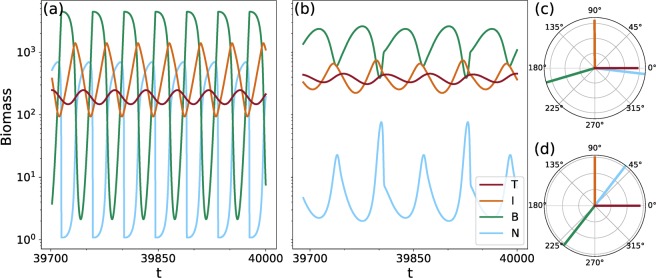
Figure 3.
Biomass and nutrient dynamics on the two different states for the tritrophic chain for h = 1.1 (=), and their corresponding phase relationships. (N = nutrients, B = basal species, I = intermediate species and T = top species). The relative phases of the low-production state shown in (a) (mean nutrient level ≈ 250 μgN/l) are plotted in panel (c). The phases of the high-production state shown in (b) (mean nutrient level ≈ 10 μgN/l) are plotted in panel (d). In both cases the phases relative to the top species are shown.

