Fig. 6.
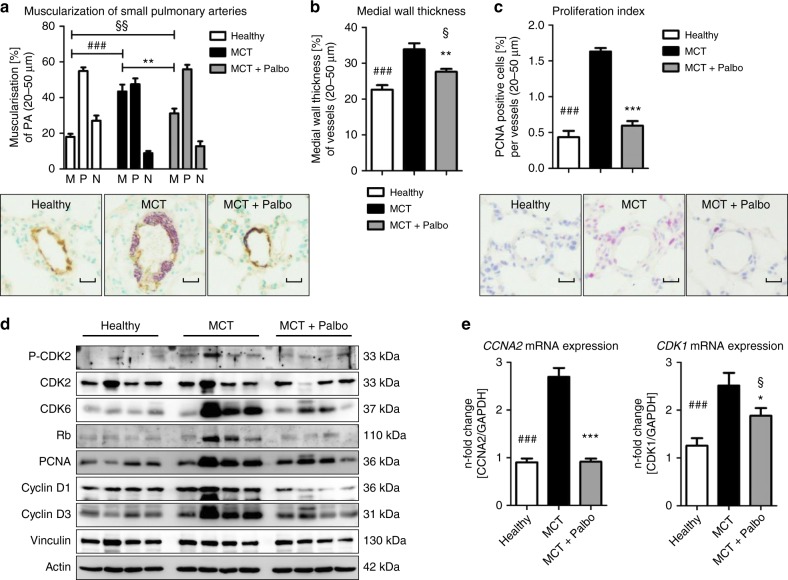
Ex vivo analyses of lung tissue for reversal of remodeling and in vivo drug efficacy in the MCT rat model. a The degree of muscularization of small pulmonary arteries (diameter 25–50 µm) was determined ex vivo via immunhistological staining of lung sections for vWF (brown) and α-SMA (violet) together with methylgreen for counterstaining. M: fully muscularized; P: partially muscularized; N: non-muscularized. Representative images for all three study groups are shown (healthy n = 6; MCT n = 5, MCT + Palbo n = 5). Images were taken at adequate magnification with a scale bar of 20 µm. b Medial wall thickness of vessels with a diameter of 20–50 µm was determined by Elastica-van-Gieson staining and is presented as percentage. c Proliferation index as a quantitative measure of PCNA-positive cells (purple) per vessel. Representative images (using hematoxylin/eosin as counterstain) for all three study groups are included. Images were taken at adequate magnification with a scale bar of 20 µm. Data from all individual animals (healthy n = 6; MCT n = 5, MCT + Palbo n = 5) are presented as mean ± SEM of 80–100 counted vessels and statistical analysis was performed using one-way ANOVA with Newman–Keuls post-hoc test for multiple comparisons; **p < 0.01, ***p < 0.001 for MCT + Palbo versus MCT; §p < 0.05, §§p < 0.01 for MCT + Palbo versus healthy; ###p < 0.001 for healthy versus MCT. d Western blot analysis for CDK2 and CDK6 activation and subsequent Rb-E2F downstream signaling in lung homogenates of representative samples from all three experimental groups (healthy, MCT, MCT + Palbo). e Analysis of CCNA2 (left) and CDK1 (right) mRNA expression normalized to GAPDH as reference gene in lung homogenates from all three experimental groups. Data from all individual animals are presented as mean ± SEM of the n-fold change (2−∆∆Ct) compared with a healthy control rat (healthy n = 6; MCT n = 5, MCT + Palbo n = 5). Statistical analysis was performed using one-way ANOVA with Newman–Keuls post-hoc test for multiple comparisons; ***p < 0.001 for MCT + Palbo versus MCT; §p < 0.05 for MCT + Palbo versus healthy; ###p < 0.001 for healthy versus MCT. Source data are provided as a Source Data file

