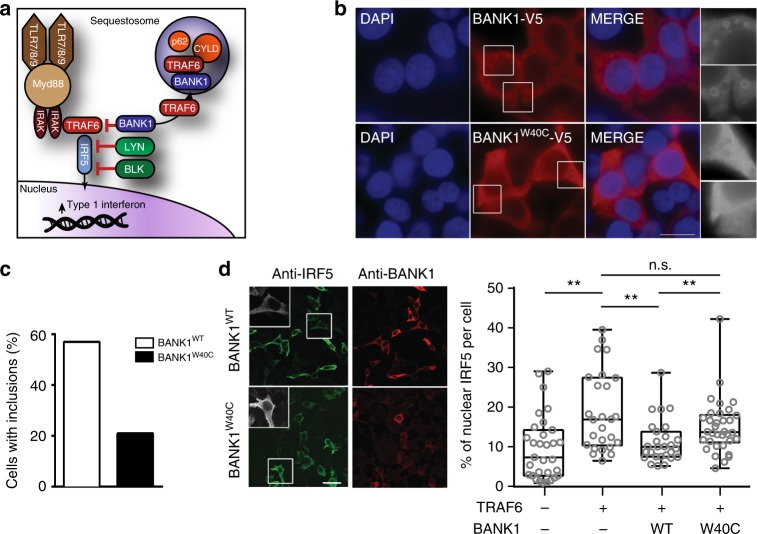
Fig. 7.
Impaired sequestration of TRAF6 by BANK1 increases nuclear IRF5. a Schematic of the role of BANK1 and BLK on regulation of T1 IFN production. Red lines indicate negative regulation. b Indirect immunofluorescence staining of HEK293T cells expressing either wild type (top panels) or W40C (bottom panels) BANK1-V5 cDNA constructs. BANK1 protein was detected using an antibody specific for the V5 tag (red). DNA was stained with DAPI (blue). Scale bar 20 μm. c Quantification of the percentage of HEK293T cells expressing WT or W40C BANK1-V5 with cytoplasmic inclusion bodies. Cells were transfected with 3 μg of the BANK1-V5 cDNA constructs and stained 72 h post transfection. Greyscale inserts show enlargements of the indicated cell sections. Double blind cell counting was carried out on at least 100 cells per experiment with three experimental replicates. d Representative images of indirect immunofluorescence staining of HEK293T cells expressing IRF5, FLAG-TRAF6 and either WT BANK1-V5 (top panel) or W40C BANK1-V5 (bottom panel). IRF5 protein was detected using an antibody specific for IRF5 (green) and BANK1 was detected using an antibody recognizing the V5 tag (red). Greyscale inserts show enlargements of the indicated cell. Scale bar 50 μm. Double blind cell counting was carried out on at least 100 cells per experiment with n = 3 experimental replicates. Bar graph represents quantification of the percentage of nuclear IRF5 as a proportion of the total IRF5 per cell based on indirect immunofluorescence staining of HEK293T cells expressing IRF5, FLAG-TRAF6 and either WT BANK1-V5 or W40C BANK1-V5 (as in (d)). Quantification was performed using the ImageJ software64. (Centre line = median, box = 25th to 75th percentile, whiskers = range; *p < 0.05, **p < 0.01, Mann–Whitney U, representative of two experimental replicates)

