Fig. 4.

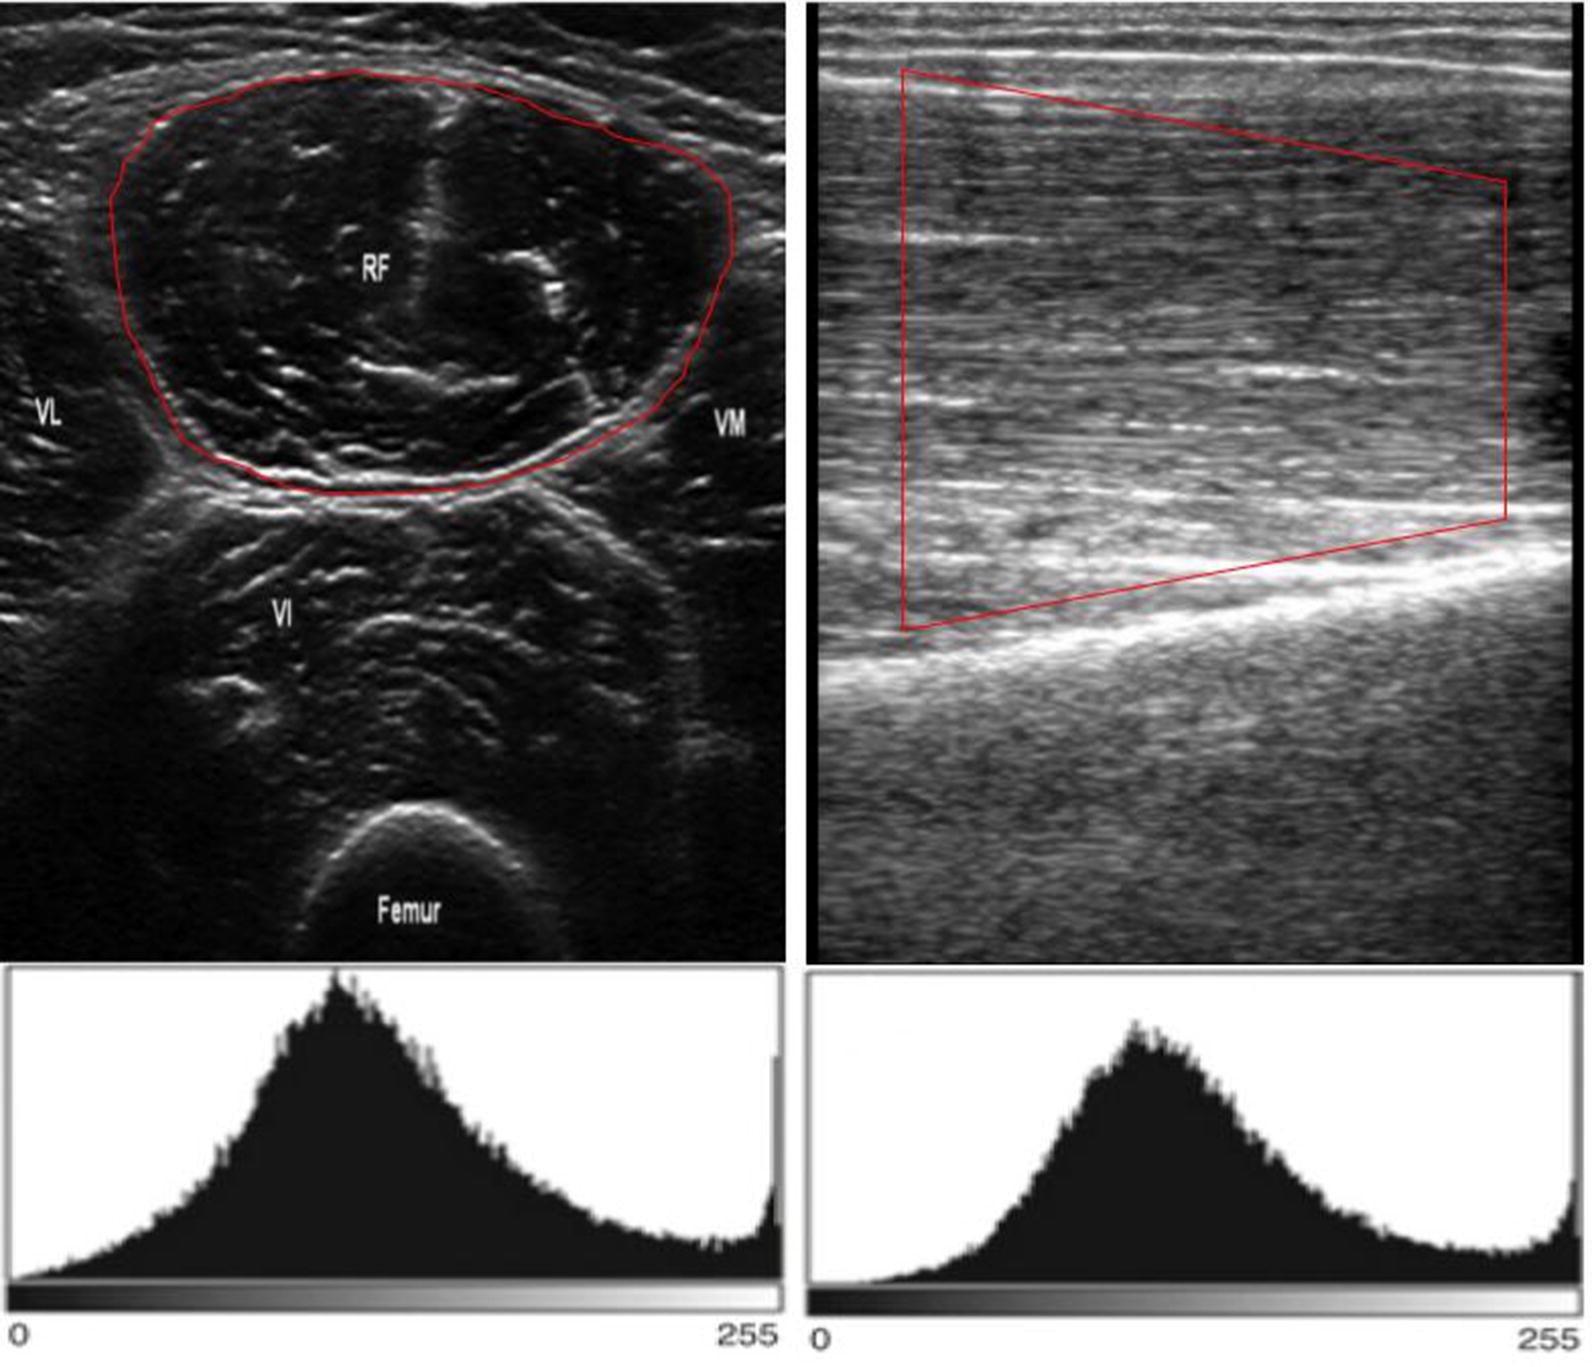
The muscle ultrasound echointensity. An example of the grayscale histogram in the transverse (right) and longitudinal (left) axis of the rectus femoris

The muscle ultrasound echointensity. An example of the grayscale histogram in the transverse (right) and longitudinal (left) axis of the rectus femoris