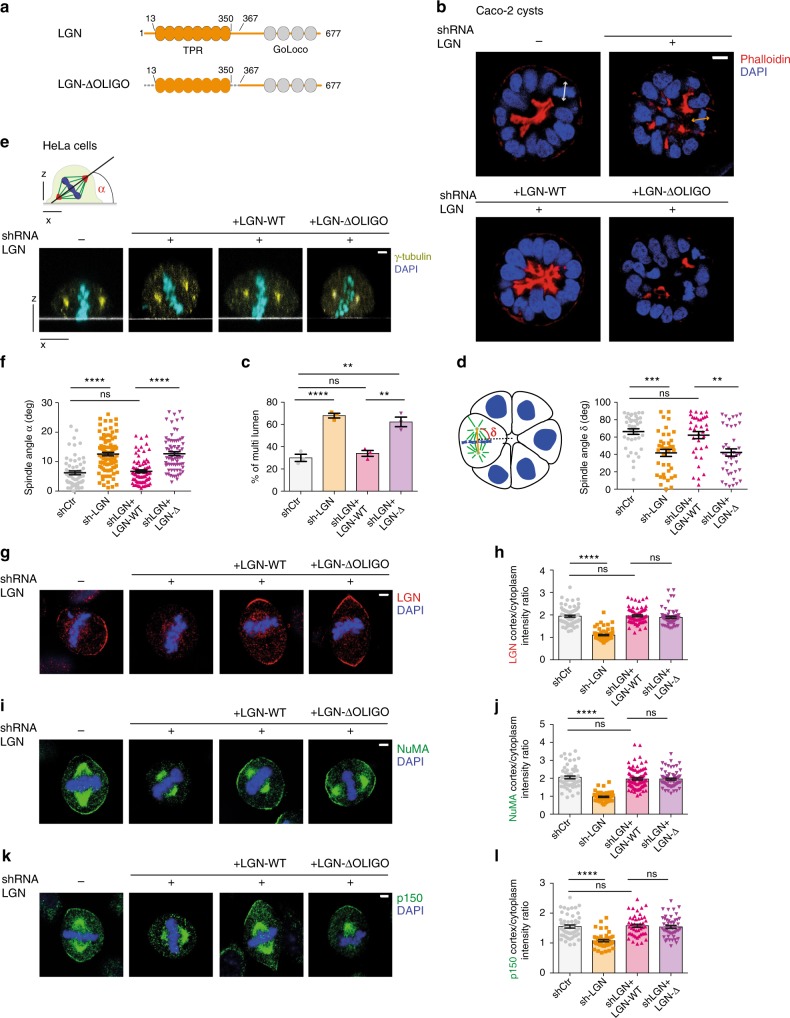
Fig. 3.
Oligomerization-proficient LGN is required for mitotic spindle orientation. a Domain structure of LGN wild-type and oligomerization-deficient mutant. Dashed lines indicate fragments of LGN deleted in the rescue construct. b Confocal sections of Caco-2 cysts grown from cells wild-type (top left) or depleted of endogenous LGN (top right) and expressing C-terminal mCherry-tagged LGN wild-type (WT, bottom left) or oligomerization deficient LGN (LGN-ΔOLIGO, bottom right). Cysts were stained with phalloidin (red), and DAPI (blue). Lines indicate the mitotic spindle. c Quantification of cystogenesis of Caco-2 cells imaged in panel b. LGN-Δ stands for LGN-ΔOLIGO. Histograms show the percentage of multi-lumen cysts. Mean and SD are shown for 3 independent experiments, with n > 60. ***p < 0.0001; **p < 0.01; *p < 0.05 by Fisher’s exact test. d Dot-plot with the distribution of metaphase spindle angle of Caco-2 cysts shown in Supplementary Fig. 3. Mean ± SEM are shown for 3 independent experiments, with n > 36. ***p < 0.001, ** indicates p < 0.01 by Krustal-Wallis test. e Confocal x–z sections of HeLa cells depleted of endogenous LGN and expressing mCherry-tagged LGN-WT or LGN-ΔOLIGO. Cells were stained with γ-tubulin (yellow) and DAPI (cyan). Quantification of the orientation was performed by measuring the angle formed by a line passing through the spindle poles and the coverslip (white line). f Dot-plot with spindle angle distributions of HeLa cells imaged in panel e. Means ± SEM are shown for 4 independent experiments, with n = 61 for control, n = 94 for LGN-shRNA, n = 78 for LGN-depleted cells expressing LGN-WT, and n = 74 for LGN-depleted cells expressing LGN-ΔOLIGO. ****p < 0.0001 by Krustal–Wallis test. g-i-k IF of HeLa cells depleted of endogenous LGN and expressing mCherry-tagged LGN rescue constructs. Cells were stained for LGN (g), NuMA (i) or the dynactin subunit p150 (k). h-j-l Quantification of the cortical signals of HeLa cells in panels g–i–k, with histograms of the cortex-to-cytoplasm fluorescence ratio. Means ± SEM are shown for 3 independent experiments with n > 50. ****p < 0.0001 by Krustal-Wallis test. Scale bars, 5 μm for all HeLa cells, 10 μm for all Caco-2

