Figure 1.
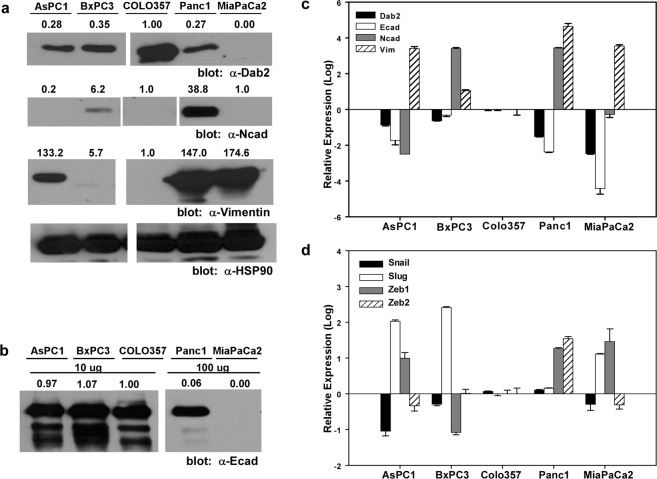
Dab2 levels correlate with EMT in pancreatic cancer cell lines. (a) Cell lysates were prepared from the indicated cell lines followed by Western blot analysis for Dab2, N-cadherin and vimentin as described in Methods. Equal protein loading is demonstrated by Western blot analysis for HSP90. Shown is a representative Western blot (n = 3 independent experiments). White space indicates removal of intervening lanes. Original blots can be found in Fig. S2. (b) E-cadherin expression is shown by Western blot analysis. A total of 10 μg of protein was used for detection in AsPC1, BxPC3 and COLO357 cells, while 100 μg of protein was used to demonstrate expression in Panc1 and MiaPaCa2 cells. Numbers above individual protein blots represent normalized expression to HSP90, with levels observed in COLO357 cells set to 1.0. White space indicates removal of intervening lanes. Original blots can be found in Fig. S2. (c,d) RNA expression of Dab2 and the indicated EMT marker proteins was measured by qRT-PCR analysis. Relative log expression levels are shown as compared to levels in COLO357 cells. Shown is the mean log expression value ± SD from an individual experiment; n = 3 independent experiments.

