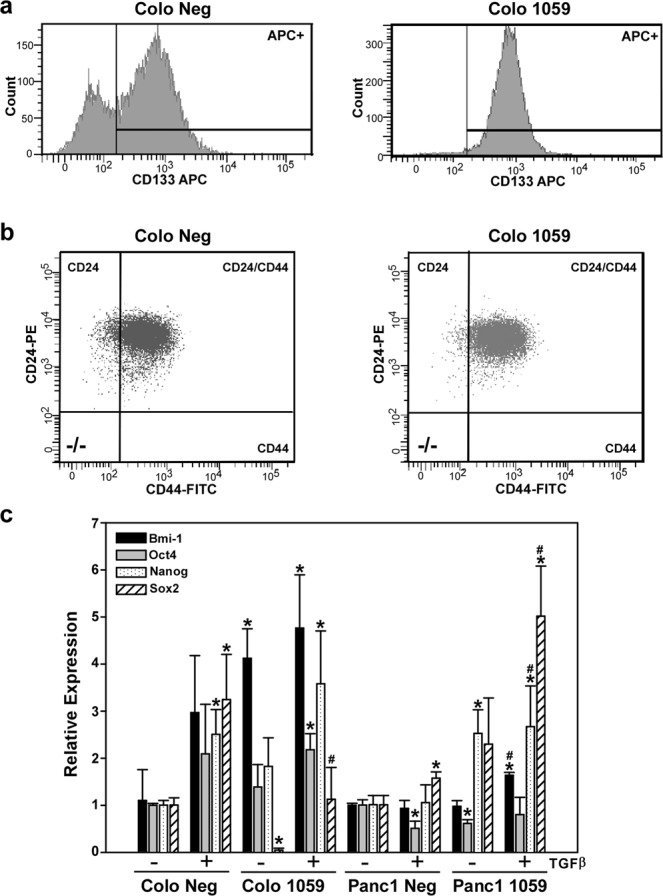
Figure 3.

Decreased Dab2 expression leads to altered expression of CSC markers. (a,b) Cell surface expression of CD133, CD24 and CD44 was determined by flow cytometry in COLO 357 and COLO357 1059 cells as described in the Methods section. Shown is a representative histogram depicting expression levels. Numerical values of expression are provided in Table 1. (c) mRNA expression for Bmi-1, Oct4, Nanog and Sox2 was determined by qRT-PCR analysis in untreated COLO357 Neg, COLO357 1059, Panc1 Neg and Panc1 1059 cells or cells treated with 2.5 ng/mL TGFβ1 for 72 hrs. Relative expression is shown, with mRNA levels in the COLO357 Neg and Panc1 Neg cell lines for each gene set to 1.0 to allow comparison to their corresponding knockdown cell lines. Shown is the mean relative expression level ± SD performed in triplicate. * signifies p < 0.05 difference in expression for comparison to untreated Neg cell line; # represents p < 0.05 difference in expression for comparison to TGFβ1-treated Neg cell line.
