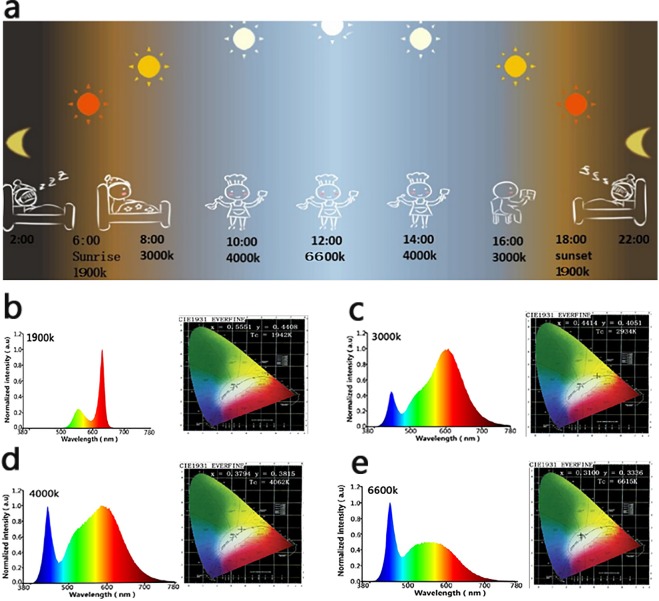
Figure 1.
(a) Schematic illustration of the relationships between sun and human’s biological rhythm. (b–e) The electro-luminance spectra and CIE1931 chromaticity diagrams of 4 different color temperature lights (1900 K, 3000 K, 4000 K, and 6600 K)were characterized by integrating sphere. The electro-luminance spectra and CIE1931 chromaticity diagrams of four artificial lights with different color temperature (1900 K, 3000 K, 4000 K, and 6600 K) were characterized by integrating sphere.

