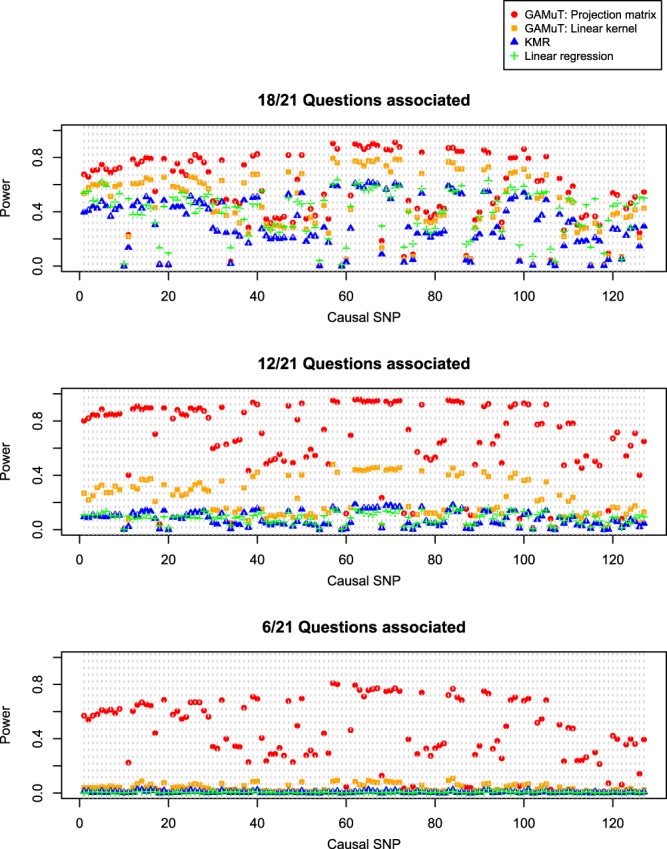
Figure 4.

Power for GAMuT, KMR, and linear regression is plotted as a function of causal SNP, for LRFN5. Top plot assumes the causal SNP is associated with 18 of the 21 BDI questions. Middle plot assumes 12 of 21 questions are associated with causal SNP. Bottom plot assumes only 6 of 21 questions are associated with the causal SNP. Results are shown applying GAMuT using a projection matrix and a linear kernel for modeling phenotypic similarity. GAMuT and KMR analyses used a weighted linear genotype kernel, with weights based on sample MAF. Sample size is 2,500. Power is calculated assuming a significance (α) level of 0.001.
