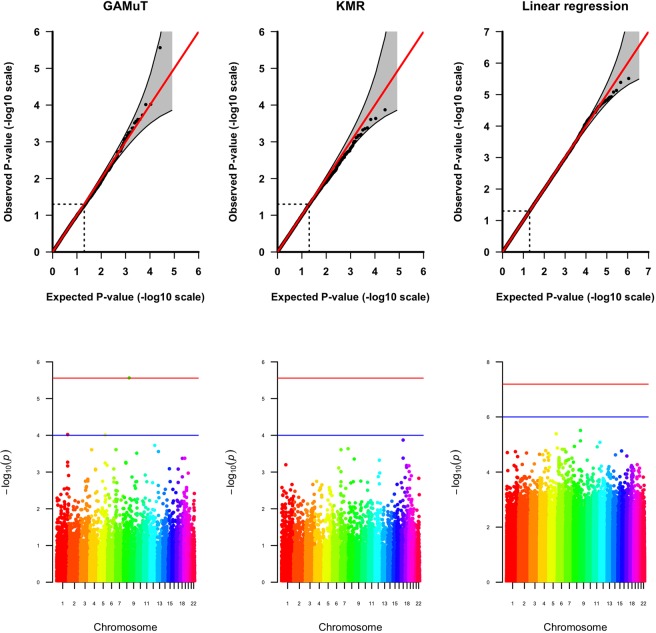
Figure 5.
QQ and Manhattan plots for GAMuT, KMR, and linear regression analyses of BDI. The GAMuT analysis used a linear kernel to model phenotypic similarity and genotype weights derived from results of the PGC GWAS for schizophrenia. The KMR analysis also used weights based on the PGC GWAS for schizophrenia. In the Manhattan plots, the red line represents the study-wise significance threshold and the blue line represents the suggestive significance threshold. The study-wise significance thresholds for the GAMuT and KMR analyses are based on a Bonferroni correction for 18,067 genes tested, while the study-wise significance threshold for the linear regression analysis is based on a Bonferroni correction for 775,255 SNPs tested. In the Manhattan plot for the GAMuT results, the point exceeding the study-wise significance threshold is the −log10(P-value) for ZHX2, a gene on chromosome 8. These analyses used a sample of N = 3,520.

