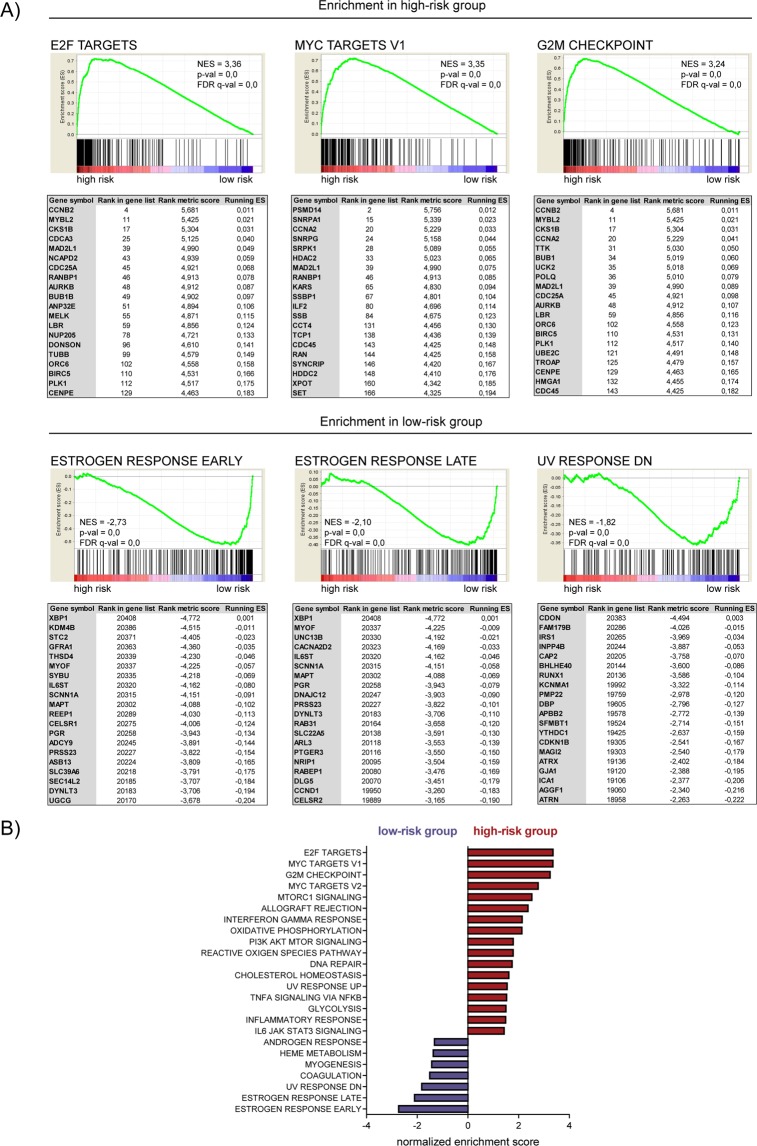
Figure 5.
GSEA results for high-risk and low-risk groups. (A) GSEA plots of three most significantly enriched datasets in high-risk (top panel) or low-risk (bottom panel) groups are shown. The tables enumerate the genes in the pathway which were the most significantly enriched in high-risk versus low-risk group (top panel) or low-risk versus high-risk group (bottom panel). NES (normalized enrichment score), p-val (nominal p-value), FDR q-val (false discovery rate). (B) Normalized enrichment scores for GSEA analysis of MSigDB hallmark gene sets enriched in high-risk (RED) or low-risk (VIOLET) groups. Gene sets with p ≤ 0,05 and FDR ≤ 0,25 were shown.

