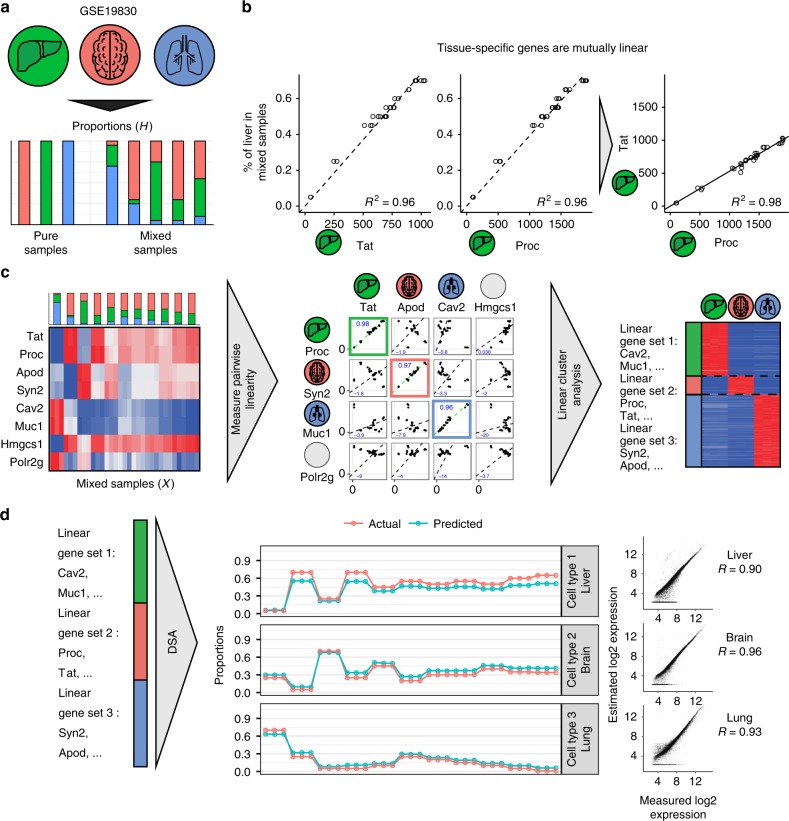
Fig. 1.
Mutual linearity of cell-type-specific genes enables complete deconvolution. a Design of gene expression dataset GSE19830. RNA from three different rat tissues: kidney, brain, and liver were mixed together in known proportions. Gene expression data for pure and mixed samples were measured via microarray profiling. b Linear regression without intercept between % of liver and Tat/Proc expression (left), linear regression between Tat and Proc (right). R² is coefficient of determination. c Approach schematics: given a gene expression matrix of mixed samples as an input we then measured pairwise similarities for each pair of genes and then identified clusters of mutually linear genes. Heatmap on the left shows expression of identified genes in pure tissues from 0 (blue) to gene max (red). d Left: Identified gene sets used as DSA algorithm input. Middle: estimated and actual fractions. Right: comparison of estimated and actual gene expression signatures. R is Pearson correlation

