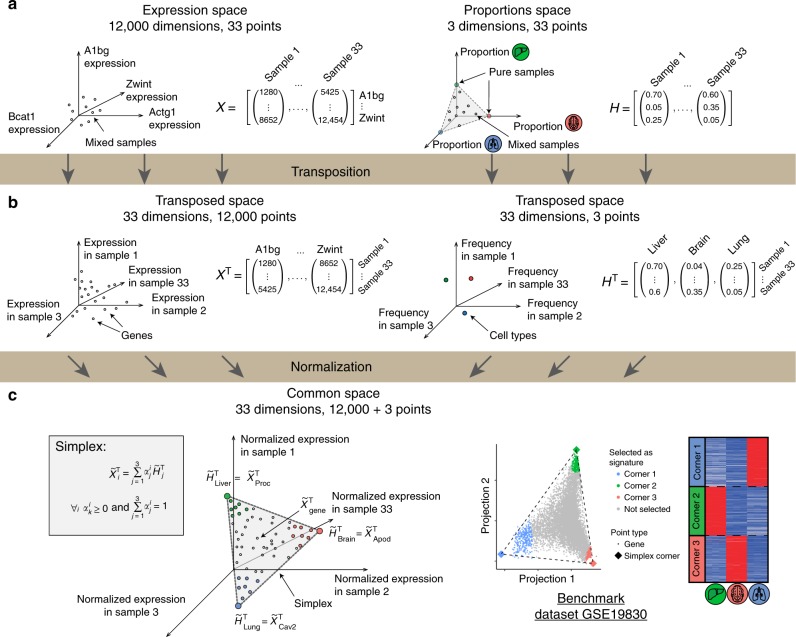
Fig. 3.
Derivation of the Transcriptional Simplex Lemma. a Samples are points in the high-dimensional gene expression space (left) or in the proportion space (right). b Transposed space contains genes as points where each gene is described by vector of its expression in 33 mixed samples (left); or pure cell type as points and each cell type is described by its proportions across 33 mixed samples (right). c Normalization aligns points from left and right parts of panel b: all expressed genes will lie within a simplex, corners of which are normalized cell type proportions (see proof in Supplementary Material). Bottom right: illustration of a simplex structure in GSE19830 dataset. One hundred genes closest to each corner were taken and expression profiles of these genes in pure samples are shown. Expression levels are from 0 (blue) to gene max (red)

