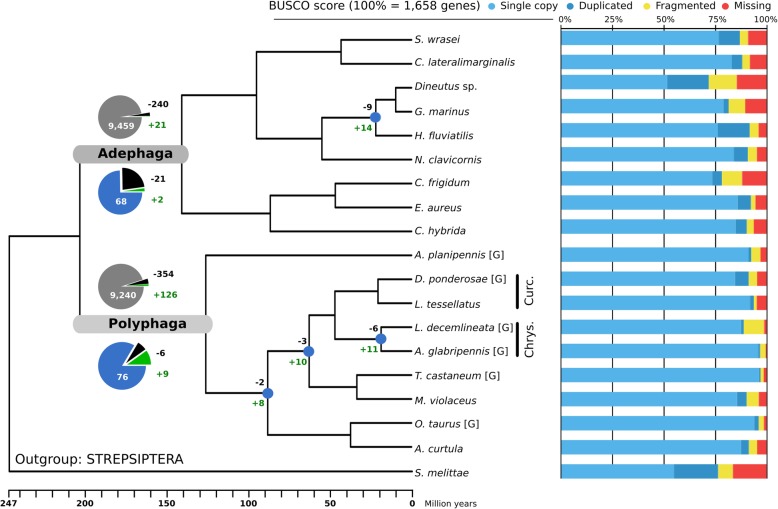
Fig. 1.
The ultrametric species phylogeny with gene family expansions and contractions quantified for nodes of interest and bar charts showing completeness of the genomic and transcriptomic datasets studied. The species tree was built from 405 single-copy orthologs and constrained to have Geadephaga (C. frigidum, E. aureus, C. hybridia) and Hydradephaga (the six other Adephaga) as monophyletic sister clades (e.g., following [6]). Branch lengths are scaled in millions of years. Maximum likelihood bootstrap support was 99 or 100% for all branches. [G] symbol indicates data from species with sequenced genomes with the remaining species being from transcriptomes. The numbers of orthologous groups (OGs) with expansions (+) and contractions (−) are displayed at the root node of each suborder. Pie charts show proportions of OGs with gene losses (black) and gene gains (green) with respect to OGs with no significant losses or gains for all considered OGs (gray) and only the candidate OGs (blue). While gains constitute only a small subset of all OGs in both suborders, the proportion of gains is much larger among candidate OGs in Polyphaga. The nodes indicated by blue circles in the Polyphaga subtree lead to species-rich clades containing species that are largely phytophagous (e.g., Chrysomelidae and Curculionidae, respectively Chrys. and Curc.) and experienced larger proportions of gains among the candidate OGs. The Benchmarking Universal Single-Copy Ortholog (BUSCO) scores indicate the relative levels of completeness and putative gene duplications for the genome-based and transcriptome-based datasets in terms of 1658 BUSCOs from the insecta_odb9 assessment dataset

