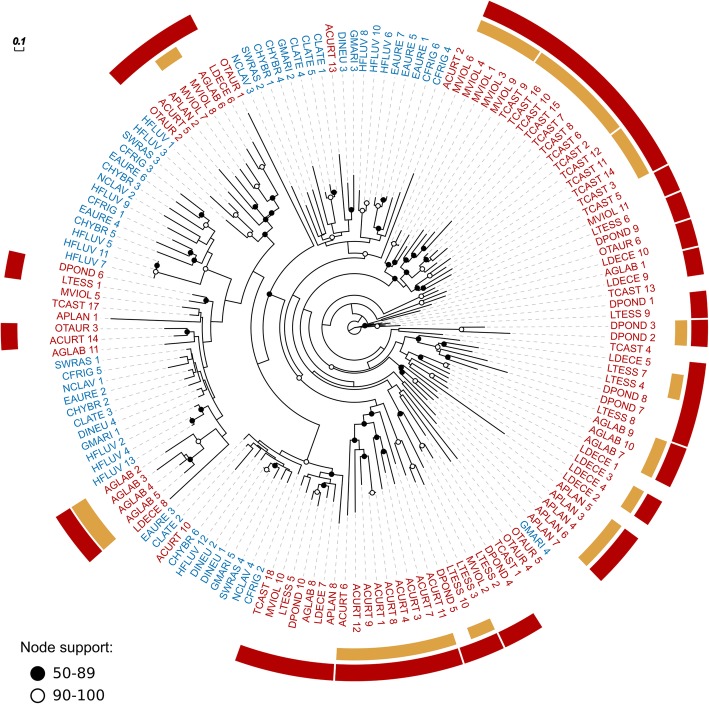
Fig. 2.
Molecular phylogeny from the largest glutathione S-transferase (GST) orthologous group among those exhibiting lineage-specific expansions driven by selection. Red labels indicate genes belonging to species of Polyphaga, accounting for 98 out of 152 genes (their Ornstein-Uhlenbeck per-species optimum is 11.69 vs. 6.85 for Adephaga (blue labels), see Table 3). The presence of several clades of polyphagan and adephagan genes delineates duplication events following the divergence of the two suborders. Encircling the gene labels are red bars that highlight polyphagan clades with bootstrap support of > 50% and yellow bars that highlight intra-specific duplications with bootstrap support of > 50%. Corresponding full names of species are given in Table 1. Branch lengths represent substitutions per site and bootstrap support below 50% is not displayed

