
Fig. 3.
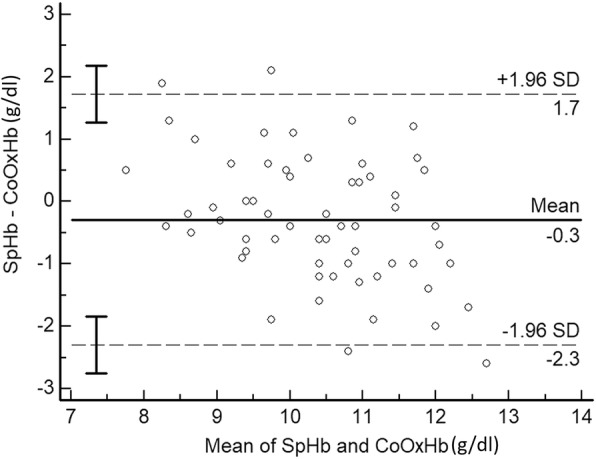
Bland-Altman analysis of SpHb and CoOxHb. Bland-Altman plot for comparison of differences in Hb values measured by pulse CO-Oximetry (SpHb) and CO-oximetry (CoOxHb) to the average Hb measurements from both methods (SpHb and CoOxHb). The dotted lines correspond to the 95% LOA corresponding to 1.96 SD