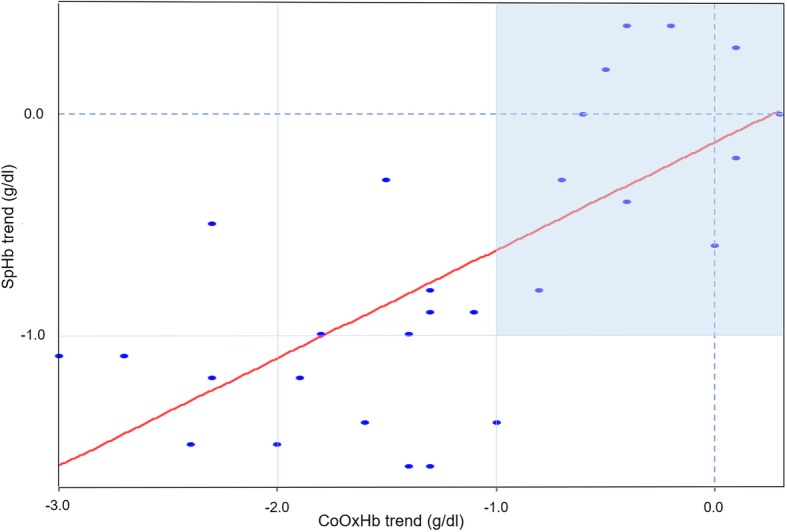
Fig. 4.

Four-quadrant plot for ΔSpHb and ΔCoOxHb. Four-quadrant graphical representation of changes in the absolute values of SpHb and CoOxHb (28 paired delta data points). The solid line indicates the regression line. Data pairs outside the dark area (exclusion zone) are over the clinically significant threshold of 1 g/dl
