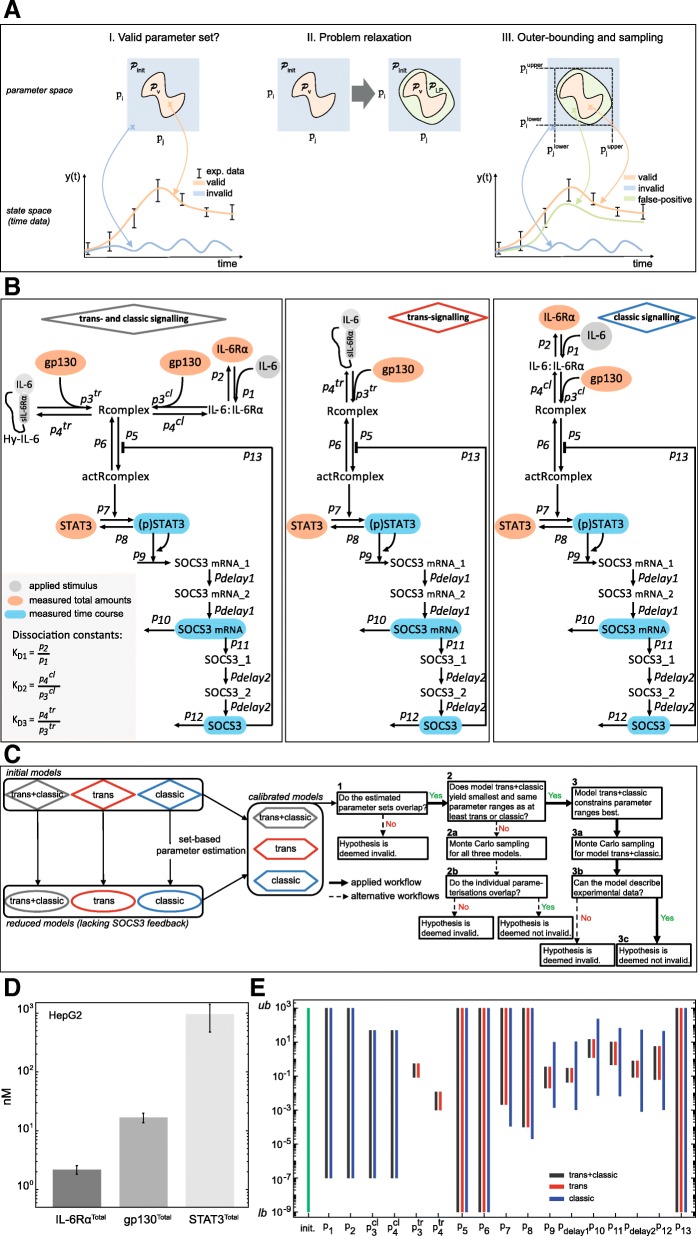
Fig. 2.
Set-based modelling, network topologies, workflow diagram and parameter estimation results. a I): To calculate model trajectories that describe experimental data, valid parameters (orange cross and trajectory) have to be distinguished from invalid ones (blue cross and trajectory). The orange area describes a set of valid parameters that represent data. Due to non-convexity of , relaxations are performed obtaining a linear program (LP). II) Relaxations result in the set that covers , but introduce also false positive solutions (green area). III) Due to relaxations, the introduced false parameter sets give model trajectories that are inconsistent with the data (green cross and trajectory). However, it is guaranteed that the valid solution set is always included. As consequence, a model is deemed invalid, whenever and thus, are empty. We apply an outer-bounding algorithm to approximate (black dotted rectangle). b Initial models describing trans- and classic signalling, trans-signalling only and classic signalling only. Classic signalling is induced by binding of IL-6 to IL-6Rα. The complex associates with gp130. Trans-signalling is induced by binding of Hy-IL-6 to gp130. In both cases the active receptor complex initiates Jak/STAT signalling and SOCS3 expression. c Workflow for set-based parameter estimation and (non-)invalidity test. Black bold arrows depict the applied workflow, while dotted arrows show alternative workflows. d Expression of gp130 and IL-6Rα in HepG2 cells was quantified by flow cytometry using QIFIKIT. Mean ± STD values from n = 4 independent experiments are shown. Expression of STAT3 in HepG2 cells was quantified by Western blotting using recombinant calibrator proteins. Mean ± STD values from n = 7 independent experiments are shown. e Results for outer-bounding of model parameters. Initial parameter bounds (green bar) range from 10− 9 (lower bound, lb) to 103 (upper bound, ub). Dark grey, blue and red bars depict ranges for parameters after set estimation of the models

