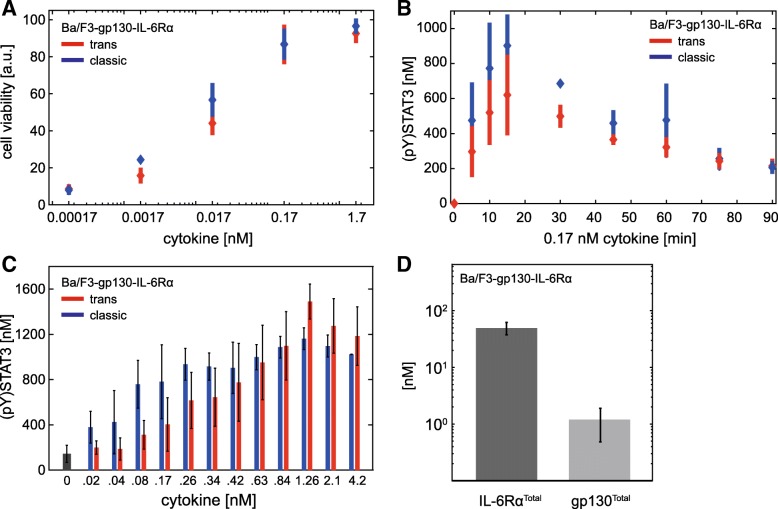
Fig. 7.
Trans- and classic signalling-induced growth of Ba/F3-gp130-IL-6Rα cells do not differ. a Ba/F3-gp130-IL-6Rα cells were stimulated with IL-6 (blue) or Hy-IL-6 (red) as indicated. After 48 h of incubation cell growth was measured using Cell Titer Blue reagent. Diamonds correspond to the mean and bars to the standard deviation for n = 4 experiments. b Ba/F3-gp130-IL-6Rα cells were stimulated with IL-6 (blue) and Hy-IL-6 (red) (0.17 nM). STAT3 phosphorylation and STAT3 expression were evaluated by Western blotting. STAT3 expression served as loading control. Diamonds correspond to the mean and bars to the standard deviation for n = 4 independent experiments. Data normalization was performed as described in Additional file 1: Text S3. c Ba/F3-gp130-IL-6Rα cells were stimulated with the indicated amounts of IL-6 (blue bars) or Hy-IL-6 (red bars), respectively. STAT3 phosphorylation was evaluated by intracellular flow cytometry using specific fluorescent antibodies against STAT3 (p)Y705. For independent experiments mean fluorescence of 104 cells per cytokine concentration was calculated. Data are given as mean ± STD from n = 3 experiments. d The expression of gp130 and IL-6Rα at the surface of Ba/F3-gp130-IL-6Rα cells was analysed by flow cytometry using QIFIKIT. Mean ± STD from n = 4 independent experiments is shown

