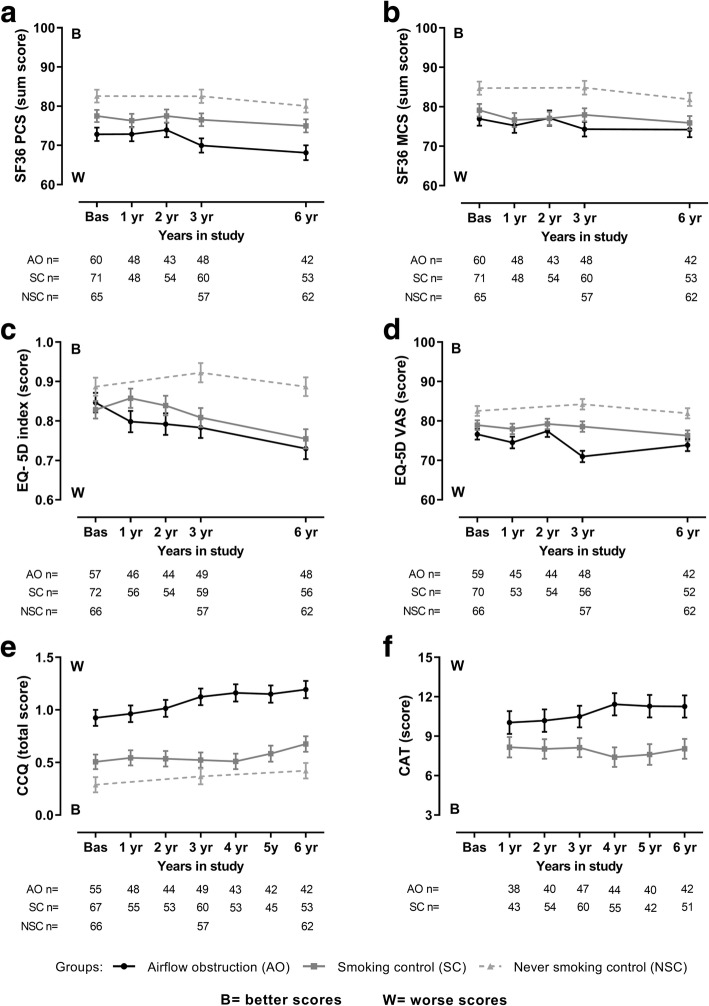
Fig. 2.
Visual representation of the changes in health status obtained with the mixed model. Data as average and standard error. Panel a) Short form 36 health survey physical component summary (SF36 PCS); b) Short form 36 health survey mental component summary (SF36 MCS); c) Generic EuroQol 5 dimensions utility index (EQ-5D index); d) Generic EuroQol 5 dimensions visual analog scale (EQ-5D VAS); e) Clinical COPD Questionnaire (CCQ); f) COPD assessment test (CAT). The airflow obstruction group (AO) is represented by circles and solid black line, the smoking control group (SC) by squares and solid dark grey line and the never smoking control group (NSC) by triangles and dashed light grey line. AO n=, SC n= and NSC n = refer to the number of valid of measurements in the three groups, in each time-point, for each instrument

