Fig. 1.

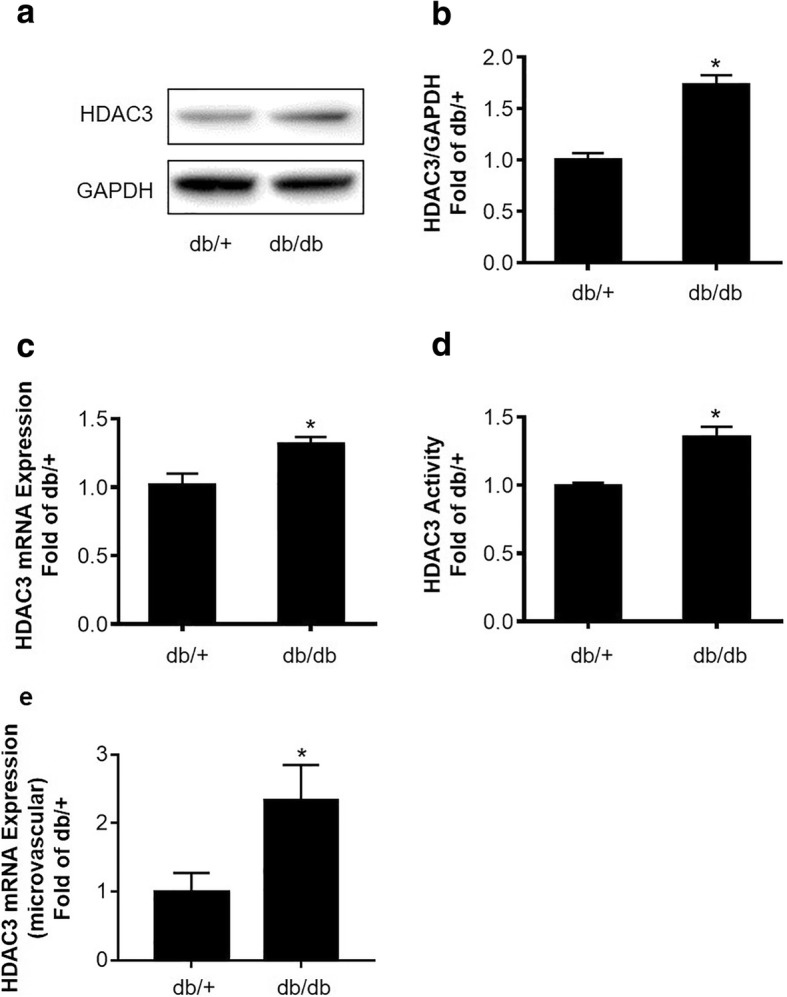
HDAC3 expression and activity are increased in the brain in db/db mice. a Representative Western blots gel images of HDAC3 expression in the mouse brain hippocampus and cortex tissues. b Quantification of Western blot analysis of HDAC3 protein expression. GAPDH served as an equal loading control. c Quantification of HDAC3 mRNA expression examined by real-time quantitative PCR. d Quantification of HDAC3 activity in nuclear extraction of brain hippocampus and cortex tissues. e Quantification of HDAC3 mRNA expression in brain microvascular examined by real-time quantitative PCR. Data are expressed as mean ± SEM, *P < 0.05 vs. db/+, n = 6 mice per group
