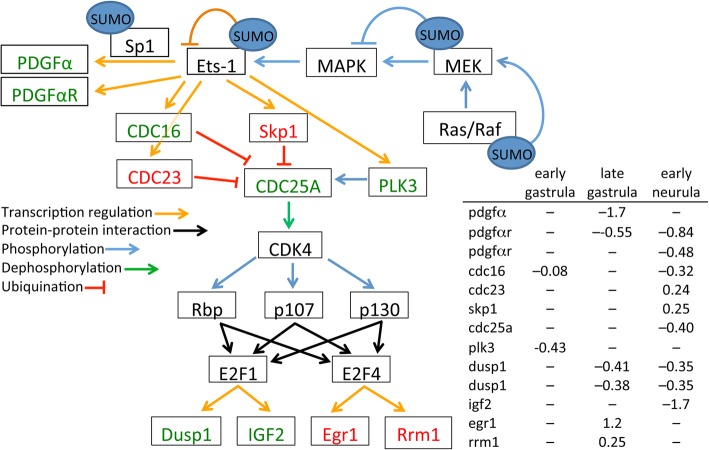
Fig. 7.
Changes in gene expression in the Ets-1 pathway. Decreased mRNA levels in Gam1 embryos relative to control embryos is represented by green and increased levels by red. Documented targets of SUMOylation are indicated. Connections by arrows represent activation and T-bars represent inhibition. Log (2) changes in gene expression are listed for the three experimental time points

