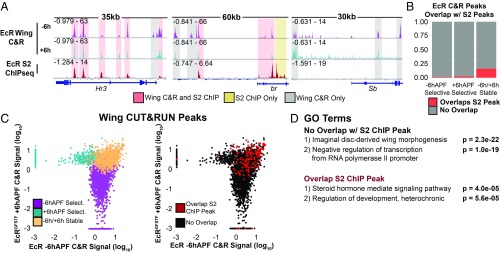
Fig. 4.
EcR binding is tissue specific. (A) Browser shots comparing EcR CUT&RUN to EcR ChIP-seq in S2 cells (16). Colored boxes highlight examples of shared (red), S2-specific (yellow), and wing-specific peaks (gray). (B) Bar plots showing the proportion of EcR C&R peaks that overlap an S2 ChIP peak in each category. (C) A comparison of the average signal within EcR C&R peaks colored by how they behave temporally (Left) and whether they overlap an S2 ChIP peak (Right). (D) GO terms of the closest gene to a wing EcR peak stratified by whether they overlap an S2 ChIP peak.

