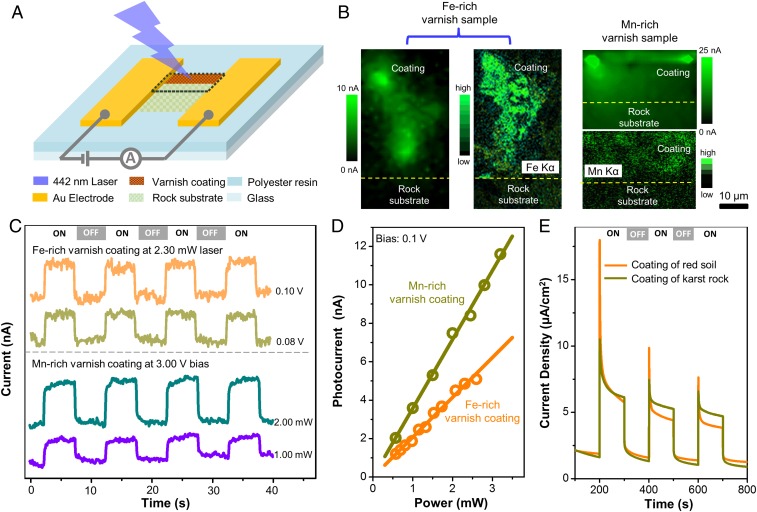
Fig. 2.
Photoelectric measurement results of mineral coatings. (A) Schematic diagram of in situ photoelectronic measurement on a rock varnish sample. (B) Photocurrent and EDX micromapping of Fe-rich and Mn-rich varnish samples (the mapping region corresponds to the area marked by the black dashed line in A). (C) Photocurrent time curves collected from varnish samples and recorded at a selected bias or light intensity. (D) Good linear relationships between photocurrents collected from varnish samples and light intensity. (E) Photocurrent time behavior of electrodes fabricated by mineral coating powders from red soil and karst rock. ON and OFF represent the state of the light source.

