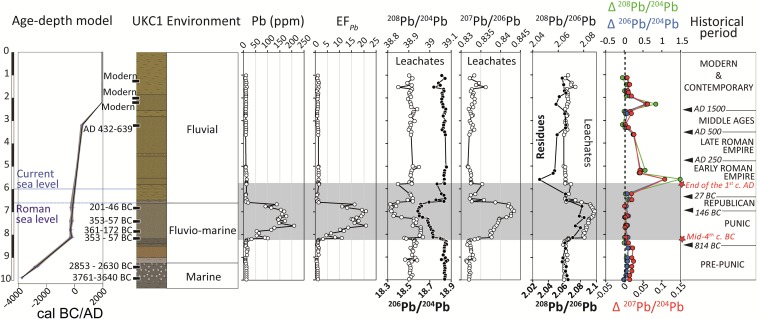
Fig. 1.
Stratigraphic log of reference core UKC1 showing the paleoenvironmental successions, current (22) and Roman (48) sea levels, and the 14C age-depth model of core UKC1 constructed using the Clam software (47) on 10 radiocarbon dates (shown with black labels on the stratigraphic log). From this age-depth model are derived both the historical time slice boundaries (indicated with black arrowheads) and the time interval of anthropogenic lead pollution highlighted by the gray band and red stars. This figure shows the Pb concentrations (in ppm); the Pb enrichment factor (EFPb); down-core variations of 208Pb/204Pb, 206Pb/204Pb, 207Pb/206Pb, and 208Pb/206Pb for leachates; 208Pb/206Pb for residues; and ΔPb (the isotopic contrast between residue and leachate) of 208Pb/204Pb, 206Pb/204Pb, and 207Pb/204Pb.

