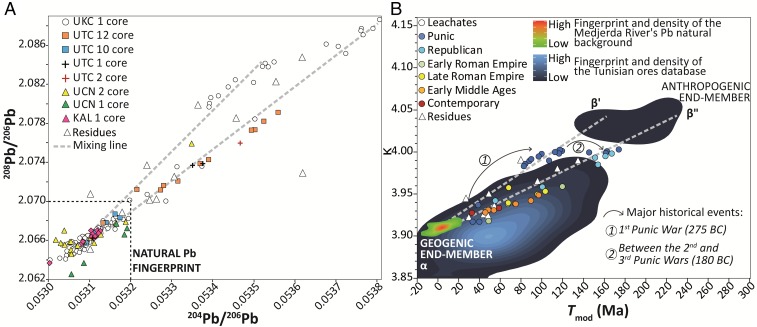
Fig. 2.
(A) Plot of 204Pb/206Pb and 208Pb/206Pb for leachates from all eight cores and for residues (white triangles) from cores UKC1 and UTC12. (B) Similar plot using the geochemically informed parameters Tmod and κ for leachates (colored circles) from all eight cores and for residues (white triangles) from UKC1 and UTC12. Colors of leachates refer to the major historical periods. The two mixing lines (gray dashes) connect α and β′, and α and β″. The α end-member corresponds to the local geogenic Pb fingerprint (unpolluted water), whereas the β end-member corresponds to the anthropogenic component, which, in turn, exhibits two distinct Tunisian Pb-Ag mining clusters, β′ and β″. References for the Pb isotope database (n = 163) of the Tunisian ores are given in SI Appendix, Supplementary Text.

