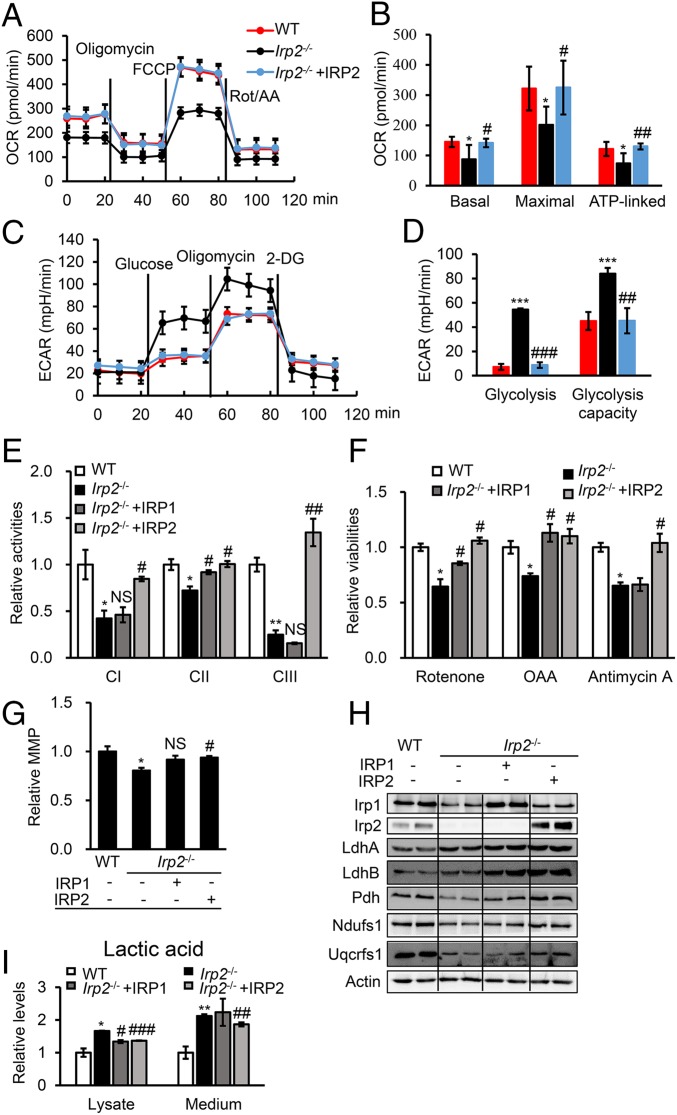
Fig. 2.
Human IRP2 rescues Irp2 ablation-induced mitochondrial dysfunction and reverses energy metabolism in MEFs. (A) Profiles of the OCR in WT and Irp2−/− cells. Oligomycin, 1 μM; FCCP, 1 μM; rotenone/antimycin (Rot/AA), 0.5 μM. (B) The calculated OCR for basal and maximal respiration and ATP production. (C) Profiles of the ECAR in WT and Irp2−/− cells.. Glucose, 10 mM; oligomycin, 1 μM; 2-deoxyglucose (2-DG), 50 mM. (D) The calculated ECAR for glycolysis and the glycolytic capacity. (E) Enzymatic activities of CI, CII, and CIII determined in Irp2-deficient MEFs after transfection with pcMV-HA-IRP1 or pDEST-his-IRP2. (F) Sensitivities to ETC complex inhibitors after IRP1 or IRP2 expression in Irp2−/− cells. The treatment with complex inhibitors was the same as in Fig. 1. (G) MMP of Irp2−/− cells after expression of IRP1 or IRP2. *P = 0.0443; #P = 0.0274; NS, P = 0.0819. (H) Protein levels of IRP1, IRP2, LdhA, LdhB, Pdh, Ndufs1, and Uqcrfs1 determined by Western blot analysis. (I) Levels of lactic acid in the medium or cell lysate of Irp2−/− cells after expression of IRP1 or IRP2. Actin was used as a loading control in Western blot analysis. Values represent the mean ± SEM (n = 3–5, each with duplicates). In B, D, E, F, G, and I, *P < 0.05, **P < 0.01, ***P < 0.001, mutant vs. WT; #P < 0.05, ##P < 0.01, ###P < 0.001, IRP rescue vs. nonrescue. NS, no significance, IRP1 rescue vs. nonrescue.

