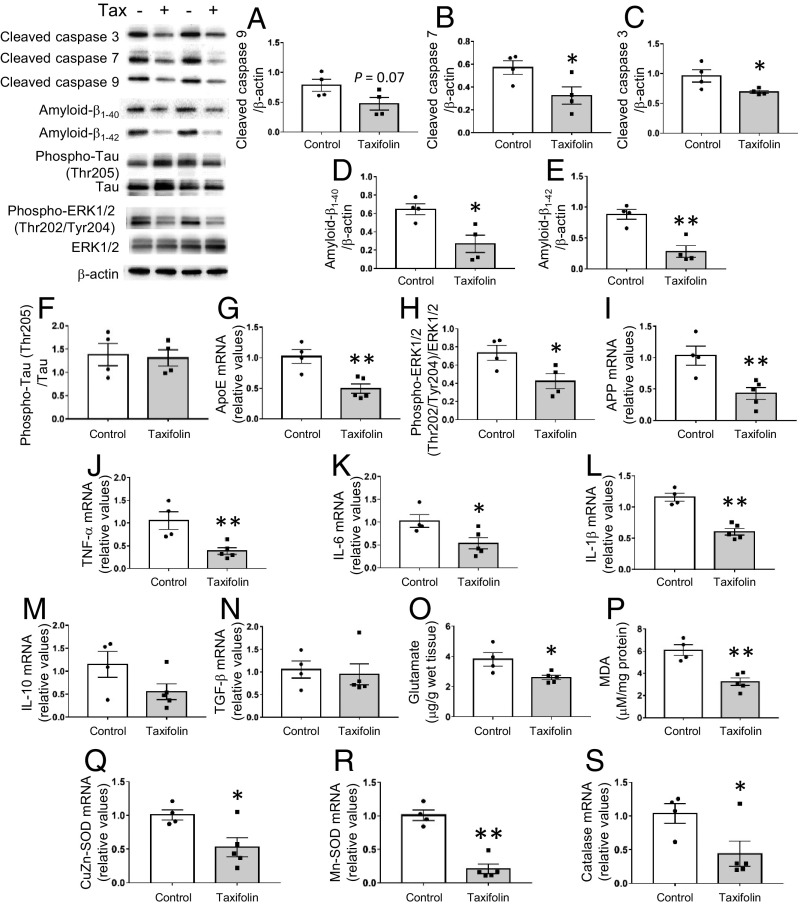
Fig. 1.
Protective effects of taxifolin on brain cells in the hippocampus of Tg-SwDI mice. Each histogram compares values for the same 14-mo-old Tg-SwDI mice that received either the control diet (n = 4) or taxifolin-containing chow (n = 5) for 13 mo. Relative amounts were analyzed by Western blot and densitometry, and mRNA expression levels were obtained by quantitative RT-PCR and normalized to those of GAPDH. Upper Left shows representative immunoblots. (A–C) Activation levels of the apoptosis-related caspases cleaved caspase-9 (A), cleaved caspase-7 (B), and cleaved caspase-3 (C) relative to β-actin. (D–F) Accumulation of amyloid-β and hyperphosphorylated tau proteins in the hippocampal tissue: amyloid-β1–40 (D) and amyloid-β1–42 (E) relative to β-actin and phospho-tau (Thr205) relative to total tau (F). (G–I) Activation levels of pathways involved in amyloid-β production in the hippocampal tissue: mRNA levels of ApoE (G) and APP (I) and the amount of phospho-ERK1/2 (Thr202/Tyr204) relative to total ERK (H). (J–N) Expression levels of proinflammatory and antiinflammatory cytokines in the hippocampal tissue: mRNA levels of TNF-α (J), IL-6 (K), IL-1β (L), IL-10 (M), and TGF-β (N). (O) Glutamate levels in the hippocampal tissue. (P) Levels of free lipid peroxides, MDA, in the hippocampal tissue. (Q–S) Expression levels of oxidative stress-responsive genes in the hippocampal tissue: mRNA levels of CuZn-SOD (Q), Mn-SOD (R), and catalase (S). Data are expressed as mean ± SEM (control, n = 4; taxifolin, n = 5). P values were determined by Student’s t test. *P < 0.05; **P < 0.01.

