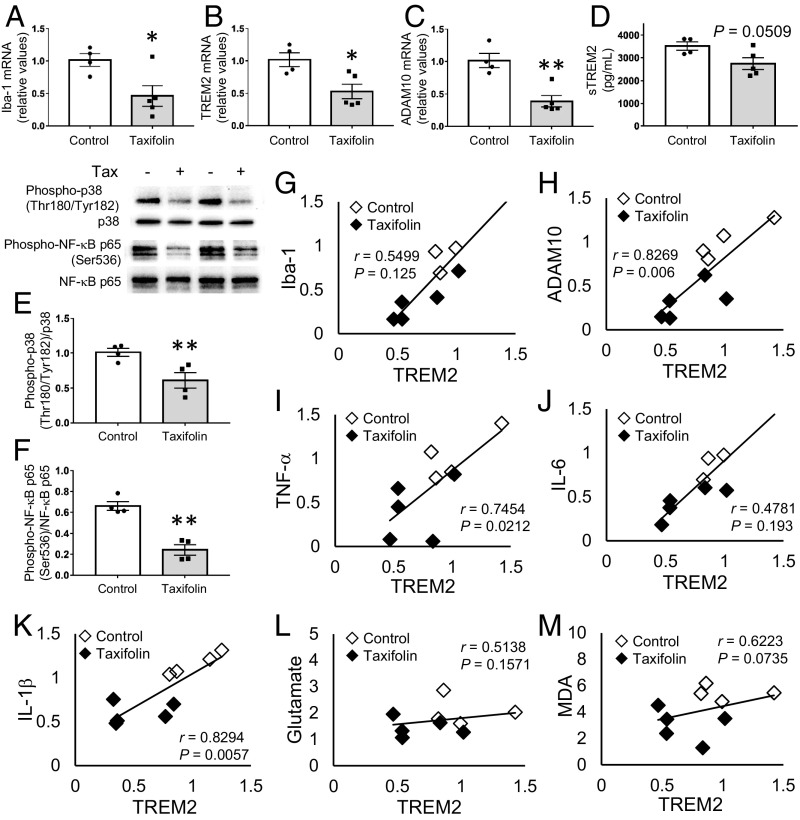
Fig. 4.
Beneficial effects of taxifolin on proinflammatory phenotypes of microglia in the hippocampus of Tg-SwDI mice. The histograms and graphs show results for the hippocampal tissue of 14-wk-old Tg-SwDI mice that received either the control diet (n = 4) or chow containing taxifolin (n = 5) for 13 mo. mRNA expression levels were measured by quantitative RT-PCR and normalized to GAPDH. (A–C) Hippocampal mRNA expression levels of Iba-1 (A), TREM2 (B), and ADAM10 (C). (D) Concentration of sTREM2. (E and F) Activation levels of proinflammatory signaling pathways. The relative amounts of phospho-p38 (Thr180/Tyr182) to total p38 (E) and phospho-NF-κB p65 (Ser536) to total NF-κB p65 (F) were determined by Western blot and densitometry. Representative images are shown at the Upper Left. (G–M) Relationships between expression levels of TREM2 and levels of Iba-1 (G), ADAM10 (H), TNF-α (I), IL-6 (J), IL-1β (K), glutamate (L), and lipid peroxidation (M) in the hippocampal tissue. In A–F, data are expressed as mean ± SEM (control, n = 4; taxifolin, n = 5); P values were determined by Student’s t test; *P < 0.05; **P < 0.01. In G–M, Pearson’s correlation coefficients (r) were used to test the associations of interest.

