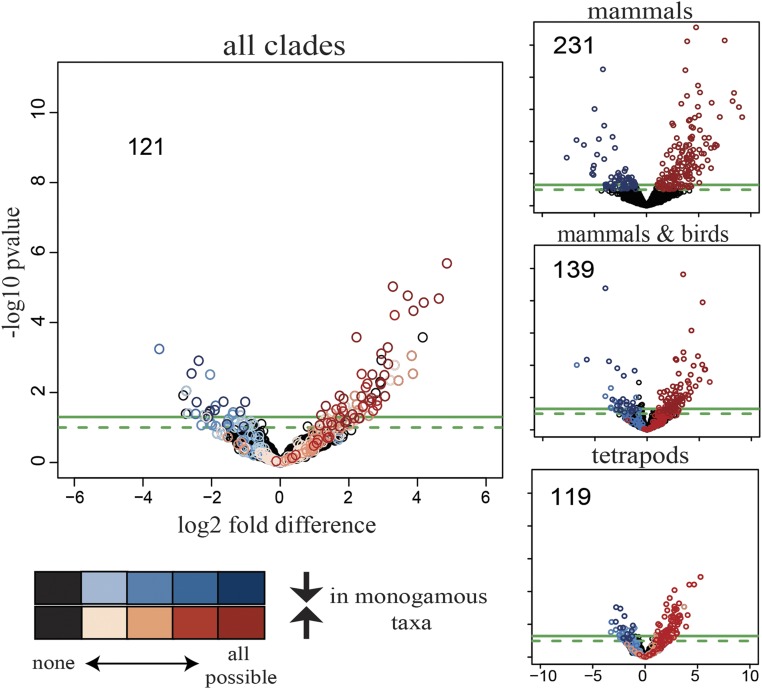
Fig. 3.
Volcano plots indicating which of the 1,979 OGGs identified across all clades are differentially expressed at different taxonomic levels (mammals only, mammals and birds, tetrapods, all clades). Differential expression analysis was performed using DESeq2, where the monogamous (nonmonogamous) species of each clade were included as interspecific replicates of monogamy (nonmonogamy). Black circles show no differential expression at any taxonomic level. Differential expression analysis was performed on distinct evolutionary subgroups: mammals only (231 OGGs concordantly regulated), mammals and birds (139 OGGs), tetrapods (i.e., including frogs; 119 OGGs), and all four clades of vertebrates (i.e., including fishes; 121 OGGs). OGGs with a –log10 P value > 1 and a log2 fold-difference less than −1 (blue) or greater than 1 (red), respectively, are highlighted. The darker each circle, the more concordant across clades is the expression of the OGG that it represents. As more lineages are added to the analysis, more OGGs that are significant in one analysis fall below the significance threshold in another; however, adding species pairs increases the statistical power due to the increased number of interspecific replicates; thus, with the exception of evolutionary-subgroup mammals only versus mammals and birds, the decrease in number of OGGs meeting our threshold cutoff is small.

