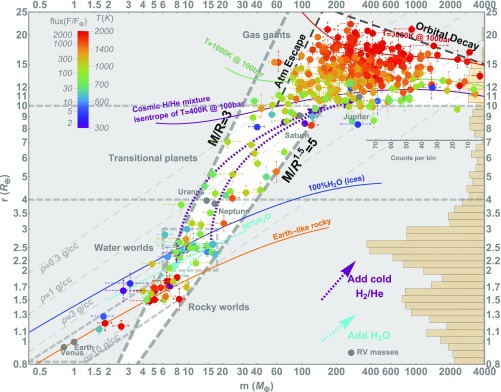
Fig. 1.
The mass–radius variations among selected exoplanets with masses determined by the radial-velocity (RV) method and densities constrained to better than ±50% (1-σ). The plotted data are listed in SI Appendix, Table S1. The color of the data points denotes stellar insolation (see legend in the upper left corner) in the Earth units (expressed as either the amount of stellar bolometric radiation reaching a given area at their orbital distances, assuming negligible orbital eccentricities, normalized to the Earth’s value or surface equilibrium temperatures assuming Earth-like albedo). The vertical histogram on the right y axis shows the log-binned radius distribution of 1,156 Kepler confirmed/candidate planets with radius errors less than ±10% (1-σ, the average error is about ±7%), orbiting only the main-sequence host stars within the effective temperatures in the 5,000–6,500 K range [Gaia Data Release 2 (7)]. The dotted cyan and purple arrows show the growth trajectories of planets formed by continuous addition of either H2O ices or H2-plus-He gas to a planetary core of a given mass (SI Appendix). The area outlined by the gray dashed rectangle is shown in Fig. 2.

