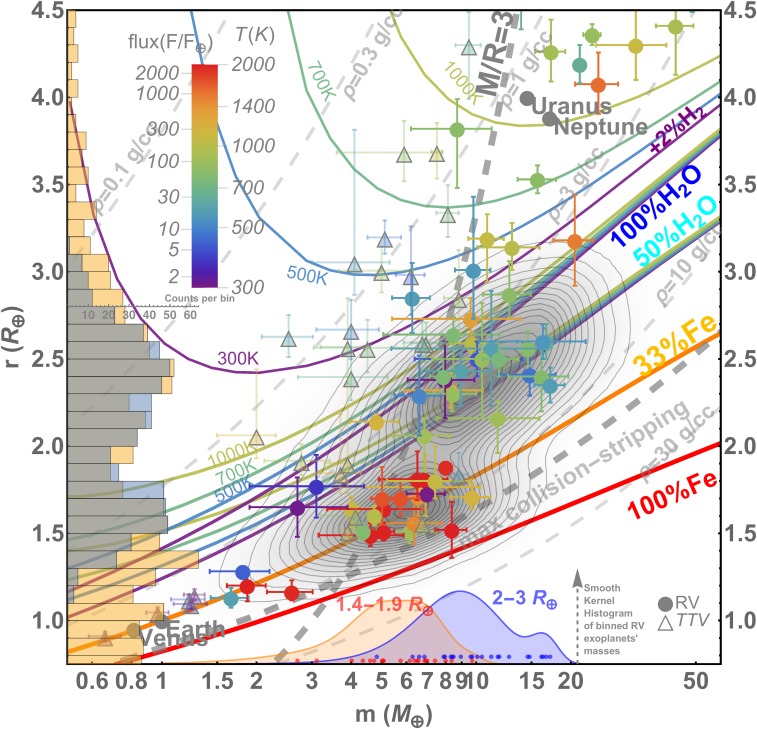
Fig. 2.
Blowup of Fig. 1. Radius gap at 2 R⊕ separates two distinctive groups of RV planets (1.4–1.9 and 2–3 R⊕). Their smooth kernel mass distributions on the bottom x axis show a significant offset, with truncation of the super-Earths (yellow) and sub-Neptunes (purple) at ∼10 and ∼20 M⊕, respectively. The histogram on the left y axis compares the results of Monte-Carlo simulation (light blue) with the observations (yellow). Two sets of H2O M–R curves (blue, 100 mass% H2O; cyan, 50 mass% H2O; cores consist of rock and H2O ice in 1:1 proportion by mass) are calculated for an isothermal fluid/steam envelope at 300, 500, 700, and 1,000 K, sitting on top of ice VII-layer at the appropriate melting pressure. A set of mass–radius curves (upper portion of the diagram) is calculated for the same temperatures assuming the addition of an isothermal 2 mass% H2-envelope to the top of the 50 mass% H2O-rich cores.

