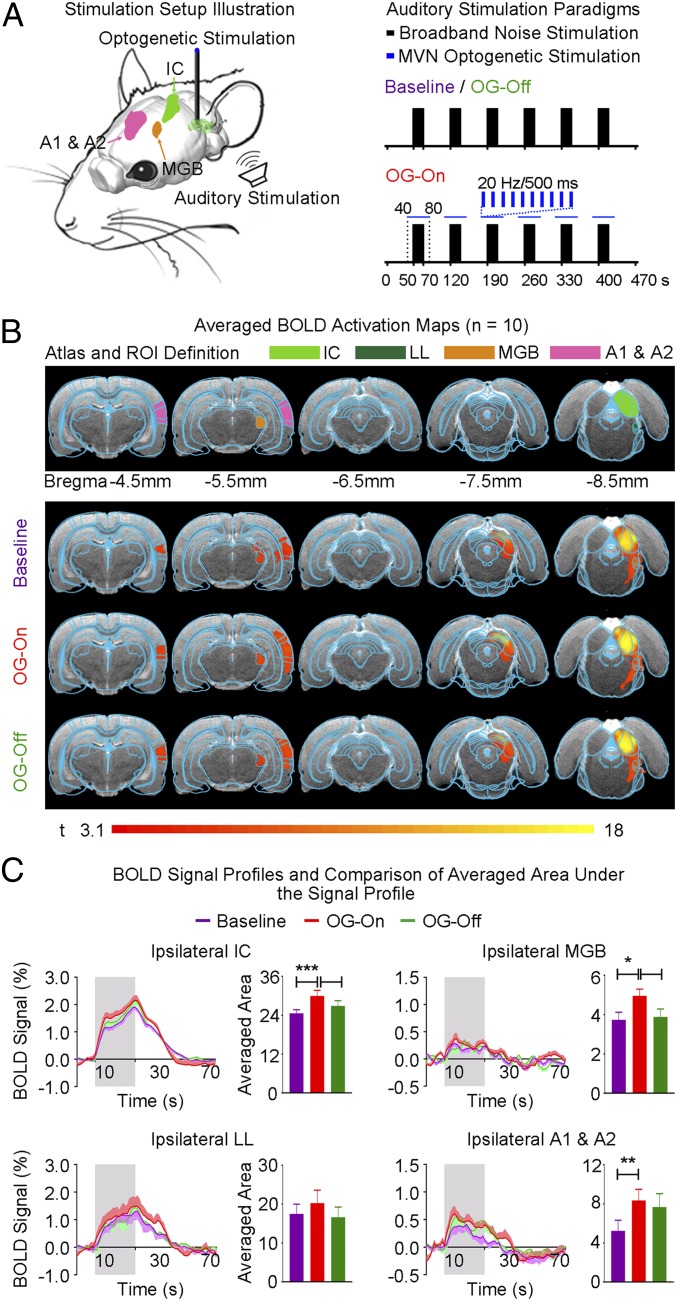
Fig. 3.
MVN optogenetic stimulation enhances responses in the ipsilateral A1 & A2, thalamus (MGB), and midbrain (IC) to sound. (A, Left) Illustration of auditory and optogenetic fMRI stimulation setup. Sound was presented monoaurally to the ear contralateral to the stimulated MVN of animals. (A, Right) Broadband noise (bandwidth: 1–40 kHz; sound pressure level: 90 dB) was presented in blocks of 20 s sound-on and 50 s sound-off before (baseline), during (OG-On), and after (OG-Off) 20-Hz optogenetic stimulation. Optogenetic blue-light pulses were presented from 10 s before to 10 s after each sound-on period. Typically, five baseline auditory fMRI scans were acquired before five OG-On scans were interleaved with five OG-Off scans. (B, Top) Illustration of atlas-based region of interest (ROI) definitions. (B, Bottom) Averaged BOLD activation maps before, during, and after 20-Hz optogenetic stimulation generated by fitting a canonical HRF to individual voxels in the fMRI image (n = 10; P < 0.001). (C) BOLD signal profiles extracted from ROIs defined in B and their corresponding averaged area under the signal profile (error bars indicate ± SEM; ***P < 0.001, **P < 0.01, and *P < 0.05 by one-way ANOVA with post hoc Bonferroni correction). BOLD responses were enhanced in the ipsilateral A1 & A2, MGB, and IC during optogenetic stimulation. These findings indicate that the auditory pathway from the midbrain to the cortical level is modulated by central vestibular pathways.

