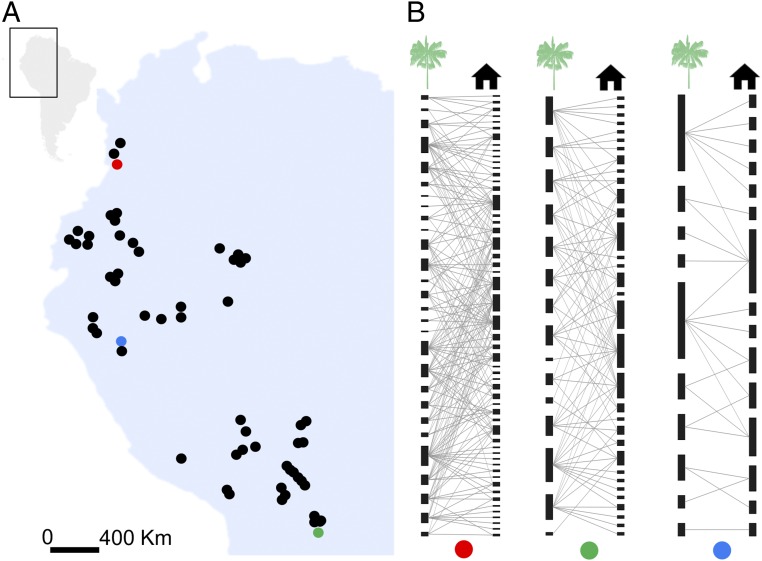
Fig. 2.
Geographic distribution of the communities studied and the architecture of indigenous knowledge networks. (A) Map of northwestern South America showing the geographic location of the 57 communities. (B) Example of three local knowledge networks (indicated by the colored dots in the map). Nodes under the green palm and black house symbols represent plant species and plant services, respectively. A link between two nodes indicates the knowledge the indigenous community has on the plant service provided by that plant species. For names of communities, see SI Appendix, Fig. S1.

