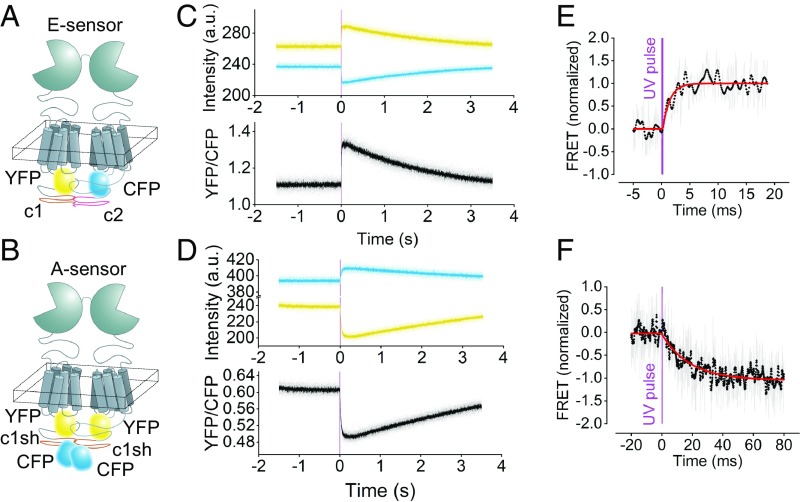
Fig. 1.
Millisecond activation of mGluR1 FRET sensors in living cells on UV light-triggered uncaging of MNI–l-glutamate. (A and B) Schematic of the E sensors (A) and A sensors (B) reporting intermolecular and intramolecular movements of the mGluR1, respectively. The E sensor is composed of one mGluR1 labeled with a CFP and one labeled with a YFP in the second intracellular loop; a C-terminal tail from the GABAB1 and GABAB2 receptors, respectively, assures that only dimers carrying two different labels reach the cell surface (20). The A sensor contains two mGluR1 protomers, each labeled with a YFP in the second intracellular loop and a CFP at the C terminus (20). (C and D) Fluorescence emission intensities recorded in real time in single intact cells expressing the E sensor (C) or the A sensor (D) before and after uncaging of 1 mM MNI–l-glutamate. Data collected from YFP, CFP, and the corresponding corrected FRET ratio are depicted in yellow, blue, and black, respectively. The transient nature of the signals is due to diffusion of uncaged glutamate away from the receptor. (E and F) Millisecond kinetics of the E- and A-sensor activation. Shown are the normalized corrected FRET ratios of single cells expressing the E sensor (E) and A sensor (F). The thickness of the purple line represents the duration of the UV pulse (300 µs). Unfiltered ratio traces (shown in gray) were low passed at 1.25 kHz (black dots). The red curves represent monoexponential fits with time constants τon = 1.2 ms (E) and τon = 18.4 ms (F).

