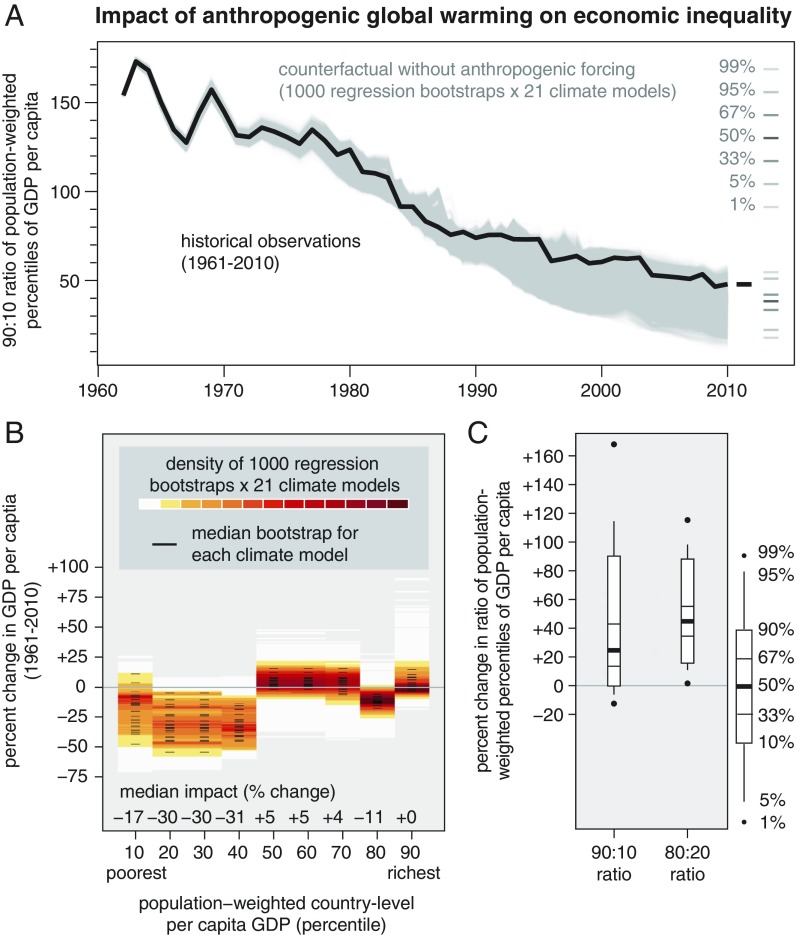
Fig. 4.
Impact of global warming on country-level inequality over the past half century. (A) The ratio between the population-weighted 90th percentile and 10th percentile country-level per capita GDP for the historical observed time series and each of the >20,000 realizations of the world without anthropogenic forcing. (B) The density of the >20,000 realizations at each decile of the population-weighted country-level per capita GDP distribution. (C) The distribution across the >20,000 realizations of percent change in population-weighted 90:10 and 80:20 percentile ratios in the year 2010, relative to the present ratio. Calculations include only those countries that have continuous socioeconomic data from 1961 through 2010 (n = 86).

